
FIGURE 4
- ID
- ZDB-FIG-220104-48
- Publication
- van de Pol et al., 2021 - Interacting Effects of Cell Size and Temperature on Gene Expression, Growth, Development and Swimming Performance in Larval Zebrafish
- Other Figures
- All Figure Page
- Back to All Figure Page
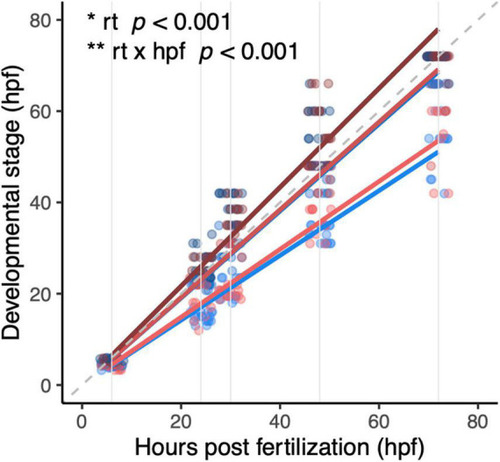
Development of diploid and triploid larvae up to 72 hpf reared at different temperatures. Light, medium, and dark blue lines represent development of diploid larvae reared at 23.5°C, 26.5°C, and 29.5°C, respectively. Light, medium, and dark red lines represent development of triploid larvae reared at 23.5°C, 26.5°C, and 29.5°C, respectively. Note that at 26.5°C and 29.5°C the red and blue lines almost entirely overlap. In this graph, the dashed gray line is the reference x = y. Solid gray lines are the hours post-fertilization at which the embryos and larvae were staged, namely: 6, 24, 30, 48, and 72 h. Effects of rearing temperature and the interaction between hpf and rearing temperature were significant (ANOVA, p < 0.001, n = 393). |