
- Title
-
Calcium Signaling in the Cerebellar Radial Glia and Its Association with Morphological Changes during Zebrafish Development
- Authors
- Pereida-Jaramillo, E., Gómez-González, G.B., Espino-Saldaña, A.E., Martínez-Torres, A.
- Source
- Full text @ Int. J. Mol. Sci.
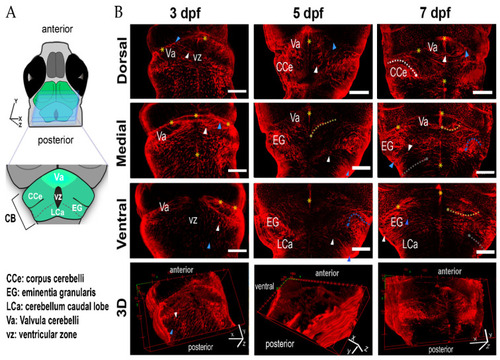
Radial glia cells during zebrafish development. (A) The scheme shows the regions of the cerebellum in the confocal images to the right. (B) Three representative optical sections of GFAP-labeled cerebella; radial glia are presented for each age: dorsal medial and ventral; the lower panels show the corresponding 3D reconstructions. In each plane, a representative soma (white arrowhead) and its end-feet (blue arrowhead) are depicted. Yellow asterisks indicate the midline and the continuum formed by the radial glia end-feet of the Va and CCe. Dashed lines show the trajectories of the radial glia processes. The position of the soma is indicated by a dot of the same color: Va, yellow dashed line; CCe, white dashed line; EG, blue dashed line; LCa, gray dashed line; dfp, days post fertilization; scale bars, 50 µm. |
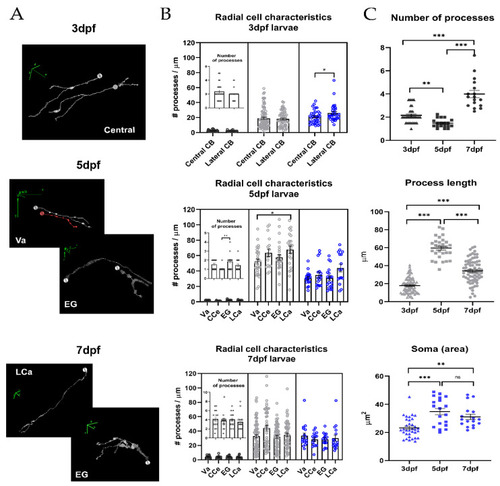
Morphometric characteristics of radial glia during cerebellar development. (A) Representative 3D reconstructions of radial glia randomly selected from different regions at 3, 5 and 7 dpf. The concentric rings along the process represent the spatial orientation and thickness of the process; in these representations, nuclei are indicated by a sphere, the processes in white and red lines and direction of the axis (x, y and z, green lines) (B) Nested graph showing the number (black dots), length (gray dots) of processes and soma area (blue dots, inset) in the different cerebellar regions at 3, 5 and 7 dpf (Va, CCe, EG and LCa; N = 5–7 larvae per stage). For simplification, only statistically significant differences are presented; cell somas at 3 dpf: central vs. lateral, 21 ± 1.5 µm2 vs. 26 ± 2.0 µm2, Mann–Whitney U test, (p-value 0.049 *, α 0.05), process length at 5 dpf: Va vs. LCa, 52.3 ± 3.3 µm vs. 67.7 ± 4.7 µm, ANOVA-Tukey (p-value 0.0309 *, α 0.05). (C) Graphs comparing the characteristics of radial glia from the whole cerebellum between the three ages evaluated (Kruskal–Wallis Test, Dunn’s post hoc, α 0.05, p-value: 0.1 (ns), 0.05 *, 0.01 **, <0.001 ***), graphs show mean ± SEM (see Table 2 for descriptive statistics). |
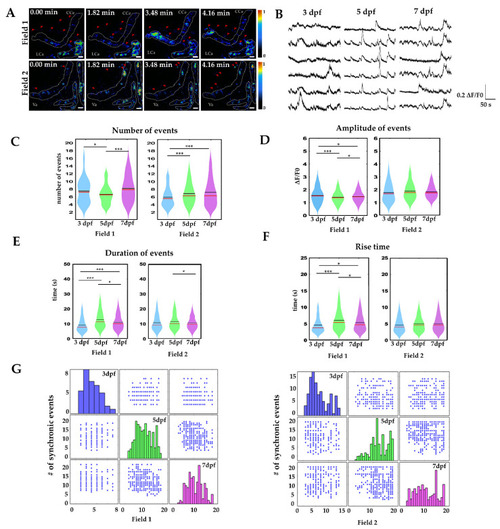
Calcium signalling during cerebellar development. (A) Calcium imaging in the lateral cerebellum at 5 dpf. A white dashed line delimits the radial glia somas; red arrowheads indicate activity in radial glia processes. (B) Sample recordings of calcium activity (ΔF/F0 during 4.16 min, at 3, 5 and 7 dpf in field 1). (C) Number of calcium events in 4.16 min. (D) Amplitude of calcium events (ΔF/F0). (E) Duration of calcium events (in seconds). (F) Rise time of calcium events (in seconds). The boxplots show data distribution, mean values (black line) and media (red line). Nonparametric statistics, Kruskal–Wallis test, α 0.05, p-value < 0.05 *, p-value < 0.001 **, p-value < 0.0001 ***. (G) Number of synchronic calcium events at 3 dpf, 5 dpf, 7 dpf (blue, green and magenta bars, respectively, scatter plot of x columns against y axes). For these experiments, at least 6 larvae per age and per field were recorded. Calcium events recorded per field 3 dpf n = 200, 5 dpf, n = 750, 7 dpf n = 400; scale bar 20 µm. |
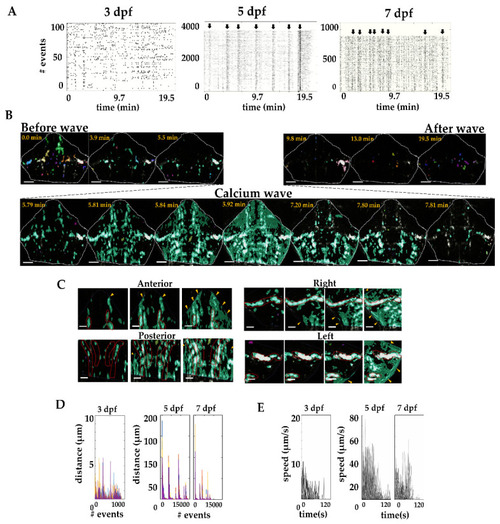
Calcium waves in the cerebellum. (A) Calcium events at 3, 5, and 7 dpf (each region of interest is aligned in time and each event is represented by a black dot, black arrows indicate the waves). (B) A calcium wave at 5 dpf. The calcium waves spread from the most posterior region of the cerebellum to the anterior region (white dashed line delineates the cerebellum). (C) Sample images of calcium activity spreading within radial glia in the lateral regions (left-right) and anterior and posterior regions. Red lines indicate the mid area where the radial glia somas are located, and yellow arrowheads indicate the pial surface where the terminal end-feet of the radial glia are located. (D) Spreading distance of calcium waves (as shown in (A)). At 5 and 7 dpf, only about 2% of the events propagated to form a calcium wave. (E) Calcium wave speed at 3, 5 and 7 dpf. 3 dpf, n = 897; 5 dpf, n = 14348; 7 dpf, n = 8848. N = 6 larvae per age. Scale bar 50 and 20 µm. |
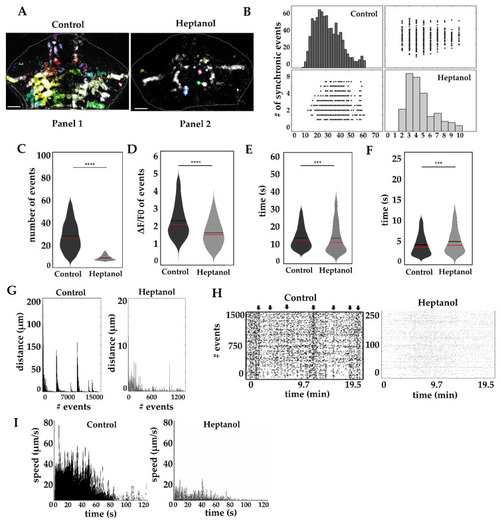
Calcium waves disruption in radial glia. (A) Calcium events in fish cerebellum after heptanol treatment (events with changes in fluorescence are shown with a multicolor mask, and the white dashed line delineates the cerebellum). Panel 1, long-distance spreading in control cerebellum, Panel 2 non-spreading events in heptanol treated fish. (B) Synchronic calcium events are reduced by heptanol treatment (black and gray bars, control and heptanol respectively. Scatter plot of x columns against y axes) (C) Number of calcium events in 19.5 min. (D) Amplitude (ΔF/F0). (E) Duration (in seconds). (F) Rise time (in seconds). (G) Propagation distance (in µm) of calcium events. (H) Raster plots of calcium waves (each region of interest is aligned in time and each event is represented by a black dot, black arrows indicate the time of occurrence of a calcium wave). (I) Maximal speed of calcium waves (µm/s). The box plots show data mean values (black line), media (red line) and data distribution. Non-parametric statistics, Mann–Whitney U test, α 0.05, p-value < 0.0001 ***, 0.00001 ****. Al recordings were obtained from 5 dpf larvae. 6 larvae were recorded for each condition. Calcium events recorded in control fish n = 14,348 and in heptanol n = 1467. Scale bar in A 50 µm. |