
Figure 3
- ID
- ZDB-FIG-220104-106
- Publication
- Pereida-Jaramillo et al., 2021 - Calcium Signaling in the Cerebellar Radial Glia and Its Association with Morphological Changes during Zebrafish Development
- Other Figures
- All Figure Page
- Back to All Figure Page
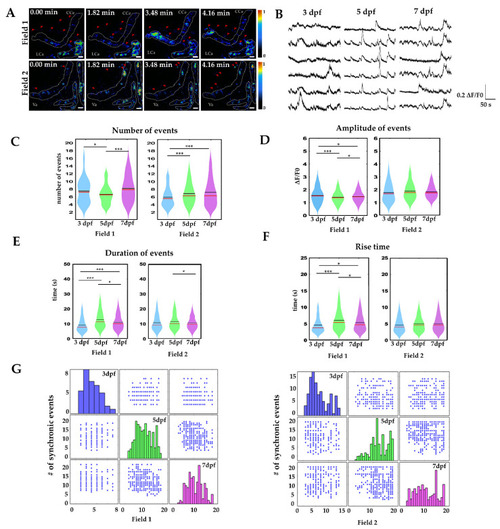
Calcium signalling during cerebellar development. (A) Calcium imaging in the lateral cerebellum at 5 dpf. A white dashed line delimits the radial glia somas; red arrowheads indicate activity in radial glia processes. (B) Sample recordings of calcium activity (ΔF/F0 during 4.16 min, at 3, 5 and 7 dpf in field 1). (C) Number of calcium events in 4.16 min. (D) Amplitude of calcium events (ΔF/F0). (E) Duration of calcium events (in seconds). (F) Rise time of calcium events (in seconds). The boxplots show data distribution, mean values (black line) and media (red line). Nonparametric statistics, Kruskal–Wallis test, α 0.05, p-value < 0.05 *, p-value < 0.001 **, p-value < 0.0001 ***. (G) Number of synchronic calcium events at 3 dpf, 5 dpf, 7 dpf (blue, green and magenta bars, respectively, scatter plot of x columns against y axes). For these experiments, at least 6 larvae per age and per field were recorded. Calcium events recorded per field 3 dpf n = 200, 5 dpf, n = 750, 7 dpf n = 400; scale bar 20 µm. |