
|
Figure 4
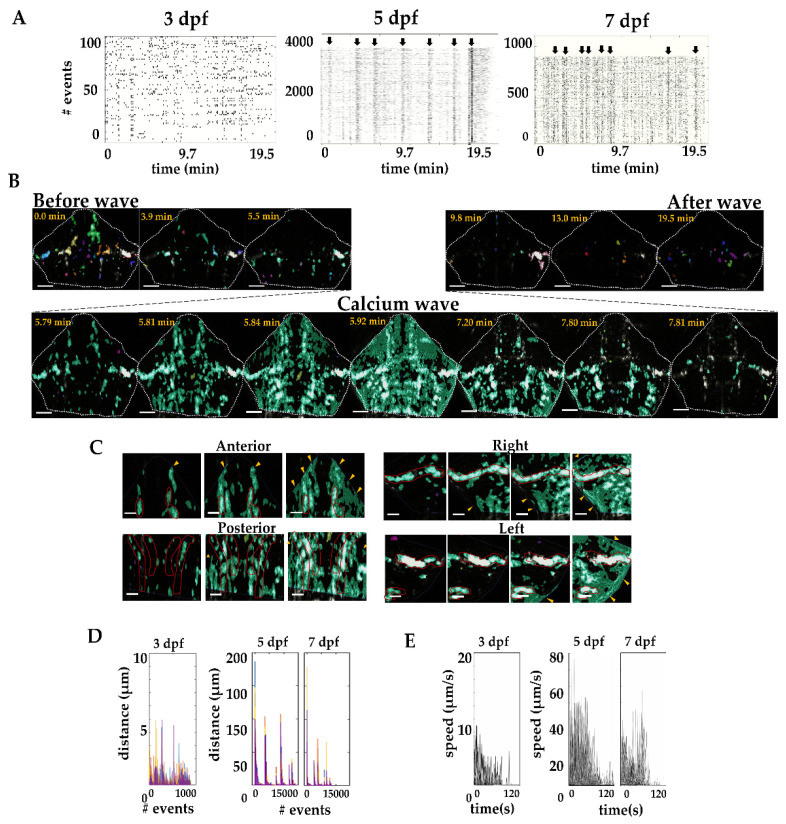
Calcium waves in the cerebellum. (A) Calcium events at 3, 5, and 7 dpf (each region of interest is aligned in time and each event is represented by a black dot, black arrows indicate the waves). (B) A calcium wave at 5 dpf. The calcium waves spread from the most posterior region of the cerebellum to the anterior region (white dashed line delineates the cerebellum). (C) Sample images of calcium activity spreading within radial glia in the lateral regions (left-right) and anterior and posterior regions. Red lines indicate the mid area where the radial glia somas are located, and yellow arrowheads indicate the pial surface where the terminal end-feet of the radial glia are located. (D) Spreading distance of calcium waves (as shown in (A)). At 5 and 7 dpf, only about 2% of the events propagated to form a calcium wave. (E) Calcium wave speed at 3, 5 and 7 dpf. 3 dpf, n = 897; 5 dpf, n = 14348; 7 dpf, n = 8848. N = 6 larvae per age. Scale bar 50 and 20 µm.