
Figure 5
- ID
- ZDB-FIG-220104-108
- Publication
- Pereida-Jaramillo et al., 2021 - Calcium Signaling in the Cerebellar Radial Glia and Its Association with Morphological Changes during Zebrafish Development
- Other Figures
- All Figure Page
- Back to All Figure Page
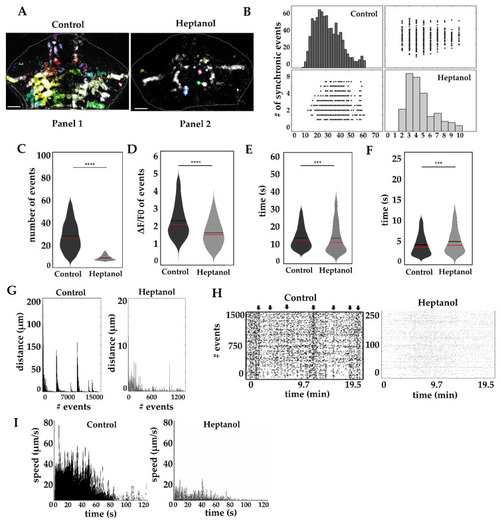
Calcium waves disruption in radial glia. (A) Calcium events in fish cerebellum after heptanol treatment (events with changes in fluorescence are shown with a multicolor mask, and the white dashed line delineates the cerebellum). Panel 1, long-distance spreading in control cerebellum, Panel 2 non-spreading events in heptanol treated fish. (B) Synchronic calcium events are reduced by heptanol treatment (black and gray bars, control and heptanol respectively. Scatter plot of x columns against y axes) (C) Number of calcium events in 19.5 min. (D) Amplitude (ΔF/F0). (E) Duration (in seconds). (F) Rise time (in seconds). (G) Propagation distance (in µm) of calcium events. (H) Raster plots of calcium waves (each region of interest is aligned in time and each event is represented by a black dot, black arrows indicate the time of occurrence of a calcium wave). (I) Maximal speed of calcium waves (µm/s). The box plots show data mean values (black line), media (red line) and data distribution. Non-parametric statistics, Mann–Whitney U test, α 0.05, p-value < 0.0001 ***, 0.00001 ****. Al recordings were obtained from 5 dpf larvae. 6 larvae were recorded for each condition. Calcium events recorded in control fish n = 14,348 and in heptanol n = 1467. Scale bar in A 50 µm. |