
|
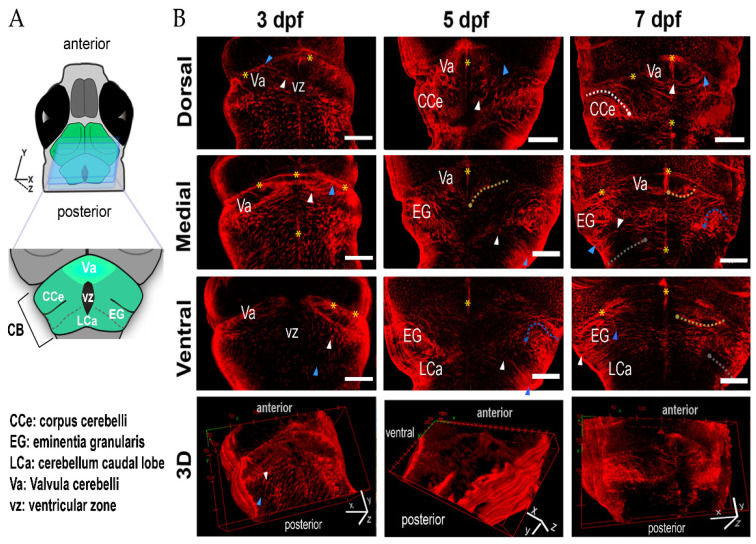
Figure 1
Radial glia cells during zebrafish development. (A) The scheme shows the regions of the cerebellum in the confocal images to the right. (B) Three representative optical sections of GFAP-labeled cerebella; radial glia are presented for each age: dorsal medial and ventral; the lower panels show the corresponding 3D reconstructions. In each plane, a representative soma (white arrowhead) and its end-feet (blue arrowhead) are depicted. Yellow asterisks indicate the midline and the continuum formed by the radial glia end-feet of the Va and CCe. Dashed lines show the trajectories of the radial glia processes. The position of the soma is indicated by a dot of the same color: Va, yellow dashed line; CCe, white dashed line; EG, blue dashed line; LCa, gray dashed line; dfp, days post fertilization; scale bars, 50 µm.