
|
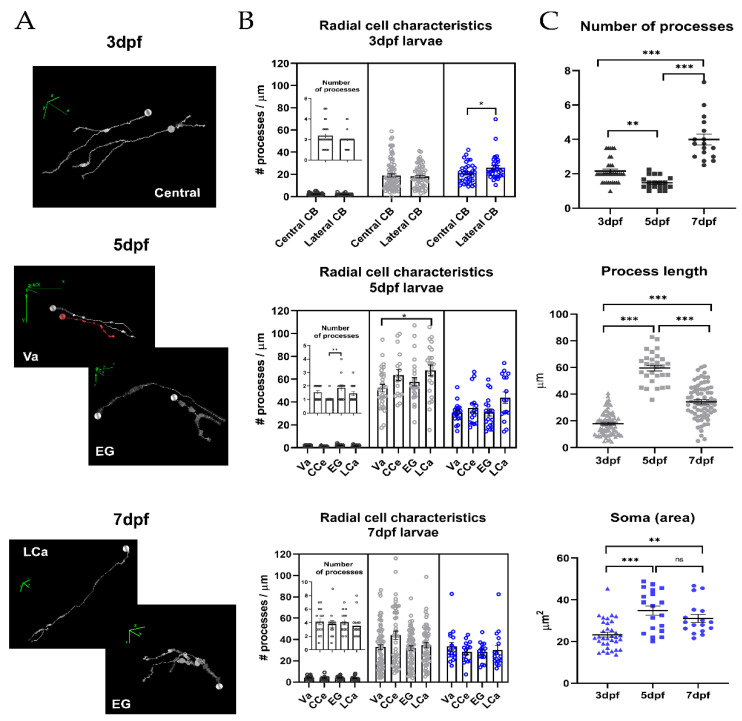
Figure 2
Morphometric characteristics of radial glia during cerebellar development. (A) Representative 3D reconstructions of radial glia randomly selected from different regions at 3, 5 and 7 dpf. The concentric rings along the process represent the spatial orientation and thickness of the process; in these representations, nuclei are indicated by a sphere, the processes in white and red lines and direction of the axis (x, y and z, green lines) (B) Nested graph showing the number (black dots), length (gray dots) of processes and soma area (blue dots, inset) in the different cerebellar regions at 3, 5 and 7 dpf (Va, CCe, EG and LCa; N = 5–7 larvae per stage). For simplification, only statistically significant differences are presented; cell somas at 3 dpf: central vs. lateral, 21 ± 1.5 µm2 vs. 26 ± 2.0 µm2, Mann–Whitney U test, (p-value 0.049 *, α 0.05), process length at 5 dpf: Va vs. LCa, 52.3 ± 3.3 µm vs. 67.7 ± 4.7 µm, ANOVA-Tukey (p-value 0.0309 *, α 0.05). (C) Graphs comparing the characteristics of radial glia from the whole cerebellum between the three ages evaluated (Kruskal–Wallis Test, Dunn’s post hoc, α 0.05, p-value: 0.1 (ns), 0.05 *, 0.01 **, <0.001 ***), graphs show mean ± SEM (see Table 2 for descriptive statistics).