
- Title
-
Soy diet induces intestinal inflammation in adult Zebrafish: Role of OTX and P53 family
- Authors
- Micheloni, G., Carnovali, M., Millefanti, G., Rizzetto, M., Moretti, V., Montalbano, G., Acquati, F., Giaroni, C., Valli, R., Costantino, L., Ferrara, F., Banfi, G., Mariotti, M., Porta, G.
- Source
- Full text @ Int. J. Exp. Pathol.
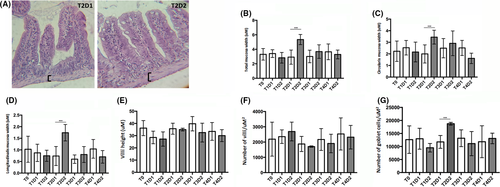
Morphometric analysis of the gut wall. Fish have been fed for one (T1), two (T2), three (T3) and four (T4) weeks with two different diet: normal (D1) or soy (D2). (A) Morphological representation of intestinal sections stained with H&E. Images represent wall thickness in control (T2D1) and treated fish (T2D2) at 2 weeks of treatment. As we can see from square brackets, treated sample shows a higher wall thickness. (B) The total wall thickness was increased after 2 weeks of treatment (T2D1 vs T2D2, p < 0.001). (C?D) The alteration can be detected in the circular smooth muscle layer (T2D1 vs T2D2, p < 0.001) as well as in the longitudinal smooth muscle layer in T2D2 (T2D1 vs T2D2, p < 0.001). (E) Morphometric measure of fold height and (F) number of folds per area indicated no significant morphological changes with soy diet. (G) Number of goblet cells per area was found increased after 2 weeks of treatment (T2D1 vs T2D2, p < 0.001). *=p<0,05 ; **=p<0,01 ; ***=p<0,001 |
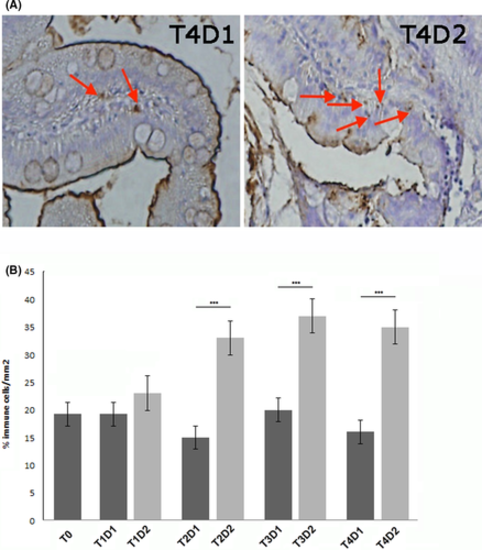
Immune cell analysis in the intestinal mucosa in fish fed with D1 and D2 at different weeks (T1?T4). (A) Myeloperoxidase (MPO) staining of neutrophils (red arrows) on intestine sections counterstained with haematoxylin. (B) An increased percentage of immune cell can be detected in the submucosal layer of SBM-treated fish from T2 to T4 (T2D1 vs T2D2, p < 0.001; T3D1 vs T3D2, p < 0.001; T4D1 vs T4D2, p < 0.001). *=p<0,05 ; **=p<0,01 ; ***=p<0,001 |
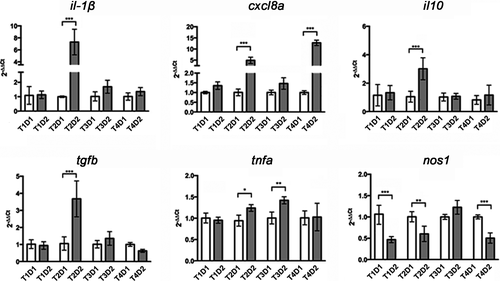
Gene expression levels of pro-inflammatory (il-1?, cxcl8a, tnfa), anti-inflammatory (tgfb and il10) and nos genes obtained by RT-PCR from intestinal tissue of fish fed with D1 and D2 at different treatment times (from T1 to T4). il-1?: T2D1 vs T2D2, p < 0.001; cxcl8a: T2D1 vs T2D2, p < 0.001; T4D1 vs T4D2, p < 0.001; il10: T2D1 vs T2D2, p < 0.001; tgfb: T2D1 vs T2D2, p < 0.001; tnfa: T2D1 vs T2D2, p < 0.05, T3D1 vs T3D2, p < 0.01; nos1: T1D1 vs T1D2, p < 0.001; T2D1 vs T2D2, p < 0.01; T4D1 vs T4D2, p < 0.001. *=p<0,05 ; **=p<0,01 ; ***=p<0,001 |
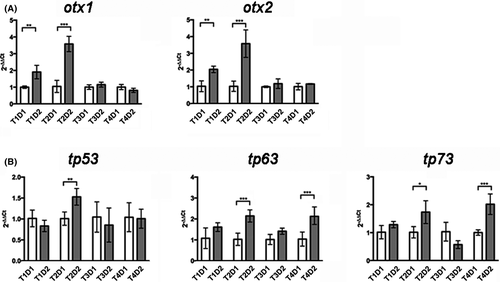
Expression analysis by RT-PCR of OTX and p53 family genes. (A) otx1 and otx2 were found upregulated in the first 2 weeks of treatment (otx1: T1D1 vs T1D2, p < 0.01; T2D1 vs T2D2, p < 0.001; otx2: T1D1 vs T1D2, p < 0.01; T2D1 vs T2D2, p < 0.001). (B) tp53 was found upregulated in treated fish at T2 only (tp53: T2D1 vs T2D2, p < 0.01), but tp63 and tp73 at T2 and T4 (tp63: T2D1 vs T2D2, p < 0.001; T4D1 vs T4D2, p < 0.001; tp73: T2D1 vs T2D2, p < 0.05; T4D1 vs T4D2, p < 0.001). *=p<0,05 ; **=p<0,01 ; ***=p<0,001 |