
|
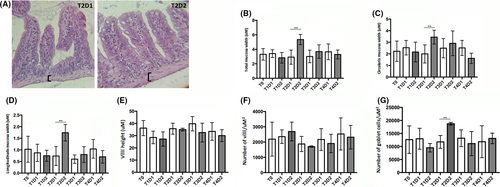
Fig. 1 Morphometric analysis of the gut wall. Fish have been fed for one (T1), two (T2), three (T3) and four (T4) weeks with two different diet: normal (D1) or soy (D2). (A) Morphological representation of intestinal sections stained with H&E. Images represent wall thickness in control (T2D1) and treated fish (T2D2) at 2 weeks of treatment. As we can see from square brackets, treated sample shows a higher wall thickness. (B) The total wall thickness was increased after 2 weeks of treatment (T2D1 vs T2D2, p < 0.001). (C–D) The alteration can be detected in the circular smooth muscle layer (T2D1 vs T2D2, p < 0.001) as well as in the longitudinal smooth muscle layer in T2D2 (T2D1 vs T2D2, p < 0.001). (E) Morphometric measure of fold height and (F) number of folds per area indicated no significant morphological changes with soy diet. (G) Number of goblet cells per area was found increased after 2 weeks of treatment (T2D1 vs T2D2, p < 0.001). *=p<0,05 ; **=p<0,01 ; ***=p<0,001