
Image
|
Figure Caption
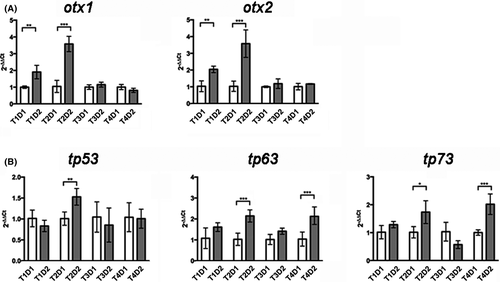
Fig. 4 Expression analysis by RT-PCR of OTX and p53 family genes. (A) otx1 and otx2 were found upregulated in the first 2 weeks of treatment (otx1: T1D1 vs T1D2, p < 0.01; T2D1 vs T2D2, p < 0.001; otx2: T1D1 vs T1D2, p < 0.01; T2D1 vs T2D2, p < 0.001). (B) tp53 was found upregulated in treated fish at T2 only (tp53: T2D1 vs T2D2, p < 0.01), but tp63 and tp73 at T2 and T4 (tp63: T2D1 vs T2D2, p < 0.001; T4D1 vs T4D2, p < 0.001; tp73: T2D1 vs T2D2, p < 0.05; T4D1 vs T4D2, p < 0.001). *=p<0,05 ; **=p<0,01 ; ***=p<0,001
Acknowledgments
This image is the copyrighted work of the attributed author or publisher, and
ZFIN has permission only to display this image to its users.
Additional permissions should be obtained from the applicable author or publisher of the image.
Full text @ Int. J. Exp. Pathol.