
Image
|
Figure Caption
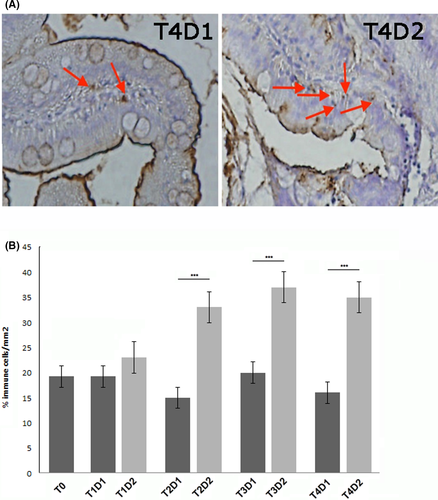
Fig. 2 Immune cell analysis in the intestinal mucosa in fish fed with D1 and D2 at different weeks (T1–T4). (A) Myeloperoxidase (MPO) staining of neutrophils (red arrows) on intestine sections counterstained with haematoxylin. (B) An increased percentage of immune cell can be detected in the submucosal layer of SBM-treated fish from T2 to T4 (T2D1 vs T2D2, p < 0.001; T3D1 vs T3D2, p < 0.001; T4D1 vs T4D2, p < 0.001). *=p<0,05 ; **=p<0,01 ; ***=p<0,001
Acknowledgments
This image is the copyrighted work of the attributed author or publisher, and
ZFIN has permission only to display this image to its users.
Additional permissions should be obtained from the applicable author or publisher of the image.
Full text @ Int. J. Exp. Pathol.