
Image
|
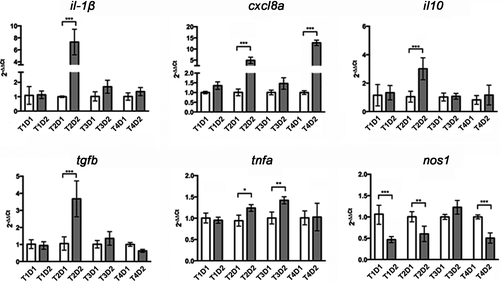
Figure Caption
Fig. 3 Gene expression levels of pro-inflammatory (il-1β, cxcl8a, tnfa), anti-inflammatory (tgfb and il10) and nos genes obtained by RT-PCR from intestinal tissue of fish fed with D1 and D2 at different treatment times (from T1 to T4). il-1β: T2D1 vs T2D2, p < 0.001; cxcl8a: T2D1 vs T2D2, p < 0.001; T4D1 vs T4D2, p < 0.001; il10: T2D1 vs T2D2, p < 0.001; tgfb: T2D1 vs T2D2, p < 0.001; tnfa: T2D1 vs T2D2, p < 0.05, T3D1 vs T3D2, p < 0.01; nos1: T1D1 vs T1D2, p < 0.001; T2D1 vs T2D2, p < 0.01; T4D1 vs T4D2, p < 0.001. *=p<0,05 ; **=p<0,01 ; ***=p<0,001
Acknowledgments
This image is the copyrighted work of the attributed author or publisher, and
ZFIN has permission only to display this image to its users.
Additional permissions should be obtained from the applicable author or publisher of the image.
Full text @ Int. J. Exp. Pathol.