
- Title
-
Targeting Oncogenic Src Homology 2 Domain-Containing Phosphatase 2 (SHP2) by Inhibiting Its Protein-Protein Interactions
- Authors
- Bobone, S., Pannone, L., Biondi, B., Solman, M., Flex, E., Canale, V.C., Calligari, P., De Faveri, C., Gandini, T., Quercioli, A., Torini, G., Venditti, M., Lauri, A., Fasano, G., Hoeksma, J., Santucci, V., Cattani, G., Bocedi, A., Carpentieri, G., Tirelli, V., Sanchez, M., Peggion, C., Formaggio, F., den Hertog, J., Martinelli, S., Bocchinfuso, G., Tartaglia, M., Stella, L.
- Source
- Full text @ J. Med. Chem.
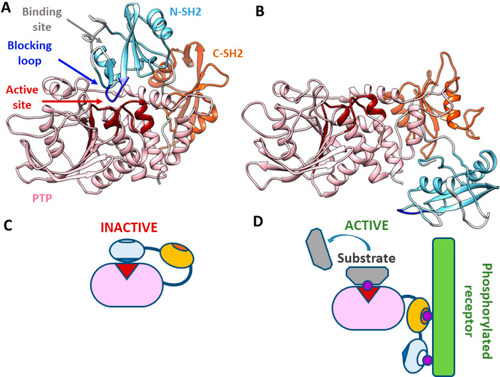
SHP2 structure and scheme of the activation process. (A) Crystallographic structure of the closed, autoinhibited state of SHP2 (PDB entry 2SHP). The active site (red) of the PTP domain (pink) is blocked by the N-SH2 domain (light blue) and particularly by its blocking loop (DE loop, blue). Access to the binding site of the N-SH2 domain is blocked by two loops (EF and BG, white). The C-SH2 domain is colored orange. (B) Crystallographic structure of the open, active state of SHP2 (PDB entry 6CRF). With respect to the autoinhibited state, the N-SH2 domain moves to the other side of the PTP domain, freeing the active site. At the same time, the EF and BG loops open and the N-SH2 binding site is accessible. Segments missing in the experimental structures were modeled as previously described.21 (C) Schematic model of the autoinhibited state. Under basal conditions, the protein is autoinhibited by the N-SH2 domain, blocking the active site. (D) Schematic model of the active state. Upon interaction with binding partners, an open, active conformation is stabilized. |
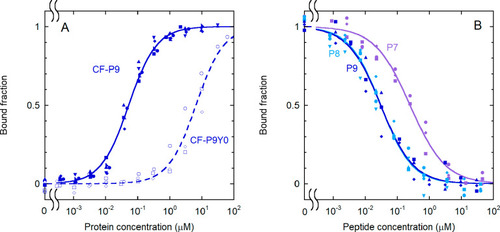
Effect of phosphorylation and sequence length on the binding of IRS-1 pY1172 peptides to the N-SH2 domain. (A) Binding curves for the phosphorylated and unphosphorylated sequence corresponding to the nine-residue region surrounding pY1172 of IRS-1 (see Table 1 for the sequences). The following experimental conditions were used: 1.0 nM CF-P9 (filled symbols and solid lines) and 10 nM CF-P9Y0 (empty symbols and dashed lines). (B) Displacement curves for unlabeled IRS-1 pY1172 analogues of different lengths [P9, P8, and P7 (see Table 1)]. A concentration of labeled peptide equal to 1.0 nM CF-P9, interacting with the N-SH2 domain (40 nM N-SH2), was displaced with increasing amounts of the unlabeled peptides. The bound fraction of labeled peptide is reported as a function of the concentration of the competing, unlabeled peptide. The results of independent, replicate experiments (n = 6 for CF-P9, n = 4 for P9 and P8, and n = 3 for CF-P9Y0 and P7) are reported with different symbols and were fit collectively. |
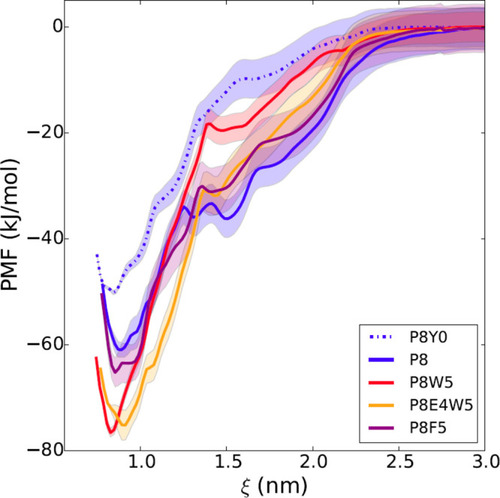
In silico free energy calculations for different modified sequences. The free energy profile is reported as a function of the distance between the centers of mass of the N-SH2 domain and the phosphopeptide. The simulations predict a loss of affinity of P8 (blue line) with dephosphorylation of the pY (dashed blue line; P8Y0 is the unphosphorylated analogue of P8) and a gain with substitution of L at position +5 with W (red line), but not with F (violet line). The additional substitution of D at position +4 with E (orange) does not provide any further increase in affinity. Shaded areas correspond to standard deviations in the PMF profile. For peptide sequences, see Table1. |
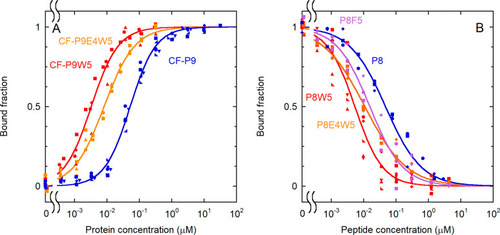
Effect of substitutions at position +5 on binding affinity. (A) Direct binding experiments with various analogues (for the peptide sequences, see Table 1). Substitution of L5 with W caused a dramatic increase in binding affinity, which was partially lost with the additional substitution of D4 with E. The following experimental conditions were used: 0.10 nM CF-P9W5, 0.10 nM CF-P9E4W5, and 1.0 nM CF-P9. Data for CF-P9 are repeated here for comparison. (B) Displacement assay, performed with various analogues (for the peptide sequences, see Table 1). A concentration of labeled peptide equal to 0.10 nM CF-P9W5, interacting with the N-SH2 domain (3.3 nM N-SH2), was displaced with increasing amounts of the unlabeled peptides. The bound fraction of the labeled peptide is reported as a function of the concentration of the competing, unlabeled peptide. The results of independent, replicate experiments (n = 5 for CF-P9 and P8W5, n = 4 for CF-P9W5, and n = 3 for CF-P9E4W5, P8, P8F5, and P8E4W5) are reported with different symbols and were fit collectively. |
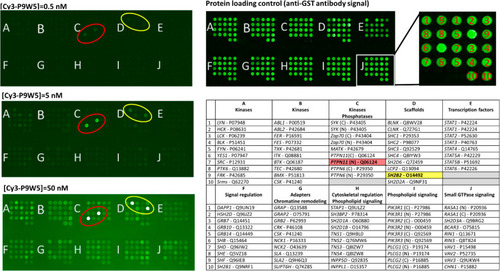
Binding selectivity of Cy3-P9W5 for an array of SH2 domains. In the left panels, the fluorescently labeled analogue Cy3-P9W5 was allowed to interact with an array of human SH2 domains, expressed and purified as glutathione S-transferase (GST) fusion constructs. Binding affinity was assessed by the fluorescence of the bound peptide, at concentrations of 0.5 nM (top), 5.0 nM (center), and 50 nM (bottom). Each SH2 domain was spotted in duplicate, and negative control spots (with GST only) are also present. The bright spots correspond to the N-SH2 domain of SHP2 (circled in red) and to the SH2 domain of the SH2 and PH domain-containing adapter protein APS (also called SHP2B2, circled in yellow). The intensity of all other spots is comparable to that of the negative controls. The right panels shows a control of the protein loading in each spot, performed with an anti-GST antibody (top), and the position of each SH2 domain in the array (bottom). For each SH2 domain, the gene name and Uniprot codes are reported. Each domain was spotted in duplicate. |
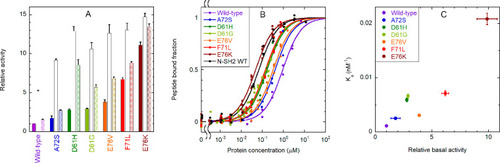
Binding of the CF-OP peptide to the whole SHP2 protein (wild type and pathogenic mutants) and activation of the phosphatase activity. (A) Relative catalytic activity of the wild-type protein and selected pathogenic mutants, under basal conditions (filled bars) and after stimulation with 10 μM BTAM peptide (empty bars) or 10 μM OP (dashed bars). All values were normalized to the basal activity of the wild-type protein. Each experiment was performed in triplicate. Binding to phosphorylated sequences induces activation. All mutations cause an increase in basal activity by destabilizing the autoinhibited conformation, and a concomitant enhanced responsiveness to activating phosphopeptides. (B) Curves for binding of the CF-OP peptide to the wild-type protein and selected mutants, obtained from fluorescence anisotropy experiments (1.0 nM CF-OP). Independent replicate experiments (n = 4 for E76K, n = 3 for E76V, F71L, D61G, and wild-type N-SH2, and n = 2 for the wild type, A72S, D61H) were fitted collectively. (C) Correlation between the relative basal activity of the various mutants (as reported in panel A) and their binding affinity (association constant, i.e., 1/Kd) for CF-OP. An enhanced basal activation of the protein, caused by destabilization of the autoinhibited state, is accompanied by an increased affinity for the CF-OP peptide. Therefore, CF-OP binds more tightly to the most activating mutants, which also cause the strongest pathogenic effects. Error bars represent standard deviations. |
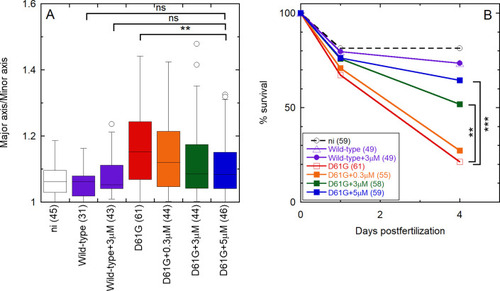
OP partially rescues D61G Shp2a-induced gastrulation defects and mortality in a dose-dependent manner in zebrafish embryos. Embryos were injected at the one-cell stage with mRNA encoding GFP-2A-Shp2-D61G or GFP-Shp2-wild-type with or without the peptide at concentrations of 0.3, 3, and 5 μM. Non-injected embryos (ni) were evaluated as a control. (A) Ovality of embryos 11 hpf, as indicated by the ratio of the long and short axis. Tukey’s honest significant difference test was performed to assess significance. In the box plot, the horizontal line indicates the median, box limits indicate the 25th and 75th percentiles (interquartile range), and whiskers (error bars) extend to the maximum and minimum values, or to 1.5 times the interquartile range from the 25th and 75th percentiles, if some data points fall outside this range. In the latter case, outliers are indicated as single data points. (B) Embryo lethality. Surviving embryos were counted 1 and 4 days post fertilization. Survival was plotted, and a log rank test was performed to access differences between groups. Nonsignificant (n.s.), p > 0.05; *p < 0.05; **p < 0.01; ***p < 0.001. The numbers of embryos that were analyzed in each case are indicated in parentheses, in the axis labels (A), or in the legend (B) and ranged from 31 to 61. |