
Fig. 1
- ID
- ZDB-IMAGE-221219-1
- Publication
- Bobone et al., 2021 - Targeting Oncogenic Src Homology 2 Domain-Containing Phosphatase 2 (SHP2) by Inhibiting Its Protein-Protein Interactions
- All Figures
- Figures for Bobone et al., 2021
|
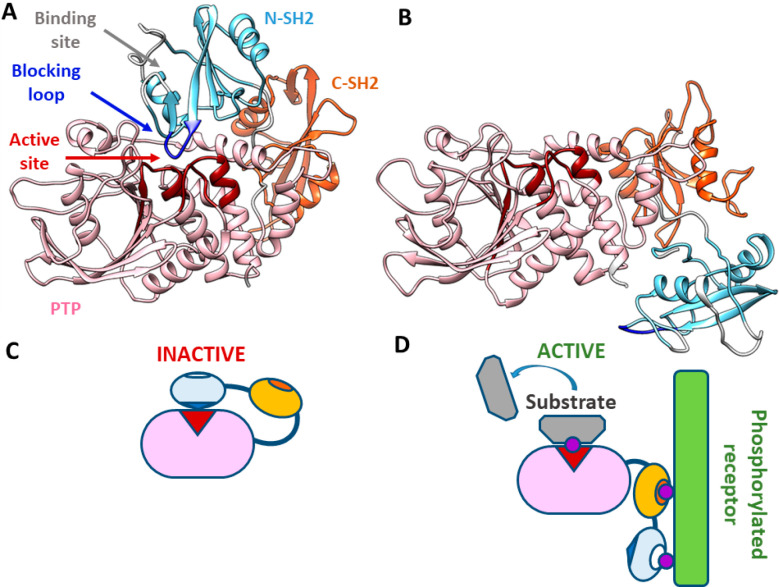
Fig. 1
SHP2 structure and scheme of the activation process. (A) Crystallographic structure of the closed, autoinhibited state of SHP2 (PDB entry 2SHP). The active site (red) of the PTP domain (pink) is blocked by the N-SH2 domain (light blue) and particularly by its blocking loop (DE loop, blue). Access to the binding site of the N-SH2 domain is blocked by two loops (EF and BG, white). The C-SH2 domain is colored orange. (B) Crystallographic structure of the open, active state of SHP2 (PDB entry 6CRF). With respect to the autoinhibited state, the N-SH2 domain moves to the other side of the PTP domain, freeing the active site. At the same time, the EF and BG loops open and the N-SH2 binding site is accessible. Segments missing in the experimental structures were modeled as previously described.21 (C) Schematic model of the autoinhibited state. Under basal conditions, the protein is autoinhibited by the N-SH2 domain, blocking the active site. (D) Schematic model of the active state. Upon interaction with binding partners, an open, active conformation is stabilized.