
Fig. 3
- ID
- ZDB-IMAGE-221219-3
- Publication
- Bobone et al., 2021 - Targeting Oncogenic Src Homology 2 Domain-Containing Phosphatase 2 (SHP2) by Inhibiting Its Protein-Protein Interactions
- All Figures
- Figures for Bobone et al., 2021
|
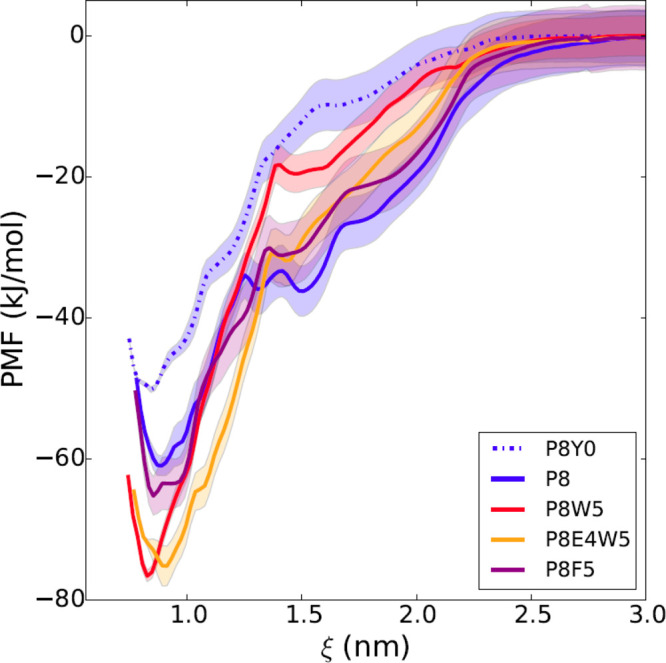
Fig. 3
In silico free energy calculations for different modified sequences. The free energy profile is reported as a function of the distance between the centers of mass of the N-SH2 domain and the phosphopeptide. The simulations predict a loss of affinity of P8 (blue line) with dephosphorylation of the pY (dashed blue line; P8Y0 is the unphosphorylated analogue of P8) and a gain with substitution of L at position +5 with W (red line), but not with F (violet line). The additional substitution of D at position +4 with E (orange) does not provide any further increase in affinity. Shaded areas correspond to standard deviations in the PMF profile. For peptide sequences, see Table1.