
Fig. 2
- ID
- ZDB-IMAGE-221219-2
- Publication
- Bobone et al., 2021 - Targeting Oncogenic Src Homology 2 Domain-Containing Phosphatase 2 (SHP2) by Inhibiting Its Protein-Protein Interactions
- All Figures
- Figures for Bobone et al., 2021
|
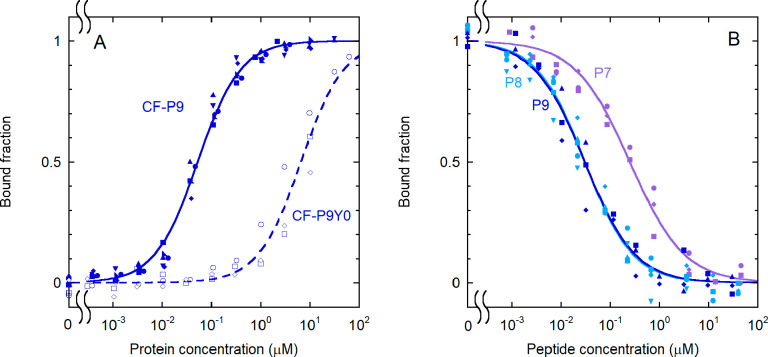
Fig. 2
Effect of phosphorylation and sequence length on the binding of IRS-1 pY1172 peptides to the N-SH2 domain. (A) Binding curves for the phosphorylated and unphosphorylated sequence corresponding to the nine-residue region surrounding pY1172 of IRS-1 (see Table 1 for the sequences). The following experimental conditions were used: 1.0 nM CF-P9 (filled symbols and solid lines) and 10 nM CF-P9Y0 (empty symbols and dashed lines). (B) Displacement curves for unlabeled IRS-1 pY1172 analogues of different lengths [P9, P8, and P7 (see Table 1)]. A concentration of labeled peptide equal to 1.0 nM CF-P9, interacting with the N-SH2 domain (40 nM N-SH2), was displaced with increasing amounts of the unlabeled peptides. The bound fraction of labeled peptide is reported as a function of the concentration of the competing, unlabeled peptide. The results of independent, replicate experiments (n = 6 for CF-P9, n = 4 for P9 and P8, and n = 3 for CF-P9Y0 and P7) are reported with different symbols and were fit collectively.