
- Title
-
Developmental Exposure to Low Concentrations of Methylmercury Causes Increase in Anxiety-Related Behaviour and Locomotor Impairments in Zebrafish
- Authors
- Glazer, L., Brennan, C.H.
- Source
- Full text @ Int. J. Mol. Sci.
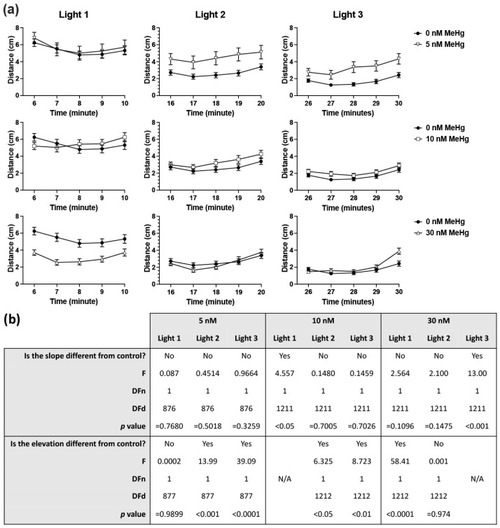
Six dpf larval locomotor activity in the three light phases of the light/dark locomotor activity assay and linear regression analysis. (a) Mean distance travelled per minute in each of the three light phases of the assay presented separately for each MeHg exposure dose compared to the control. (b) Linear regression analysis of difference in slope and elevation between each exposure dose and control. Subject numbers (N): 0 nM = 121; 5 nM = 55; 10 nM = 122; 30 nM = 122. |
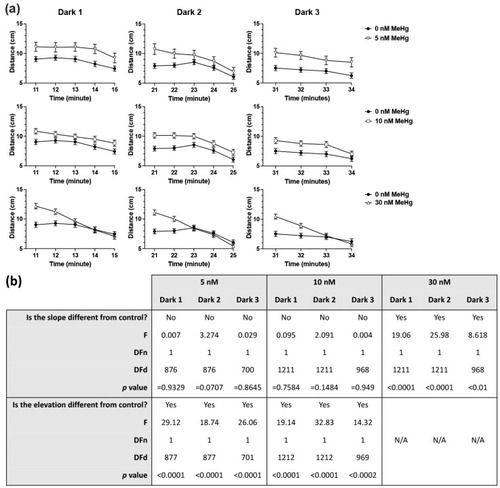
Six dpf larval locomotor activity in the three dark phases of the light/dark locomotor activity assay and linear regression analysis. (a) Mean distance travelled per minute in each of the three dark phases of the assay presented separately for each MeHg exposure dose compared to the control. (b) Linear regression analysis of difference in slope and elevation between each exposure dose and control. Subject numbers (N): 0 nM = 121; 5 nM = 55; 10 nM = 122; 30 nM = 122. |
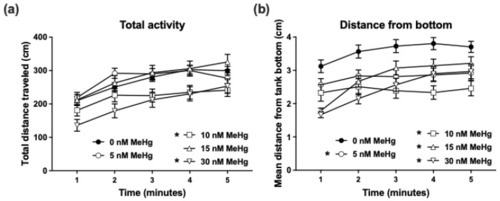
Novel tank dive test. Adult zebrafish that were developmentally exposed to 0 (control), 5, 10, 15, and 30 nM MeHg were individually placed in the testing tank (novel environment) and recorded for 5 min. Total activity (a) was calculated as the total distance travelled by the fish in each minute of the trial. Dive response (b) was calculated as the average distance of the fish from the bottom of the tank in each minute of the trial. Subject numbers (N): 0 nM = 111; 5 nM = 71; 10 nM = 52; 15 nM = 53, 30 nM = 57. Asterisks next to group names indicate significant difference from the control group. |
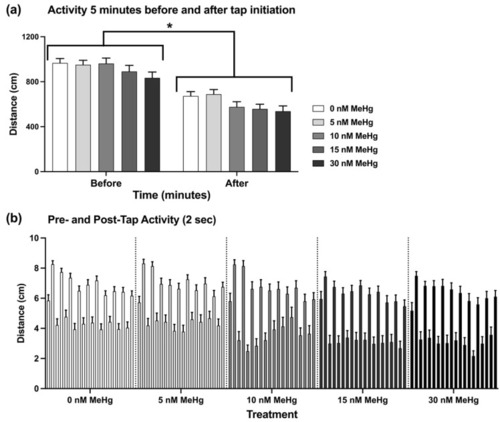
Tap test. Adult zebrafish were individually placed in cylindrical arenas, allowed a 10 min acclimation period followed by a sequence of 10 taps, one tap per minute. (a) activity in the 5 min before and after the initiation of tapping sequence. (b) activity of the fish in 2 sec pre- and post- each tap. The lower bars show the pre-tap activity and the higher bars show the post-tap activity. Subject numbers (N): 0 nM = 105; 5 nM = 72; 10 nM = 49; 15 nM = 51, 30 nM = 58. Asterisks indicate significant difference from the control group. |
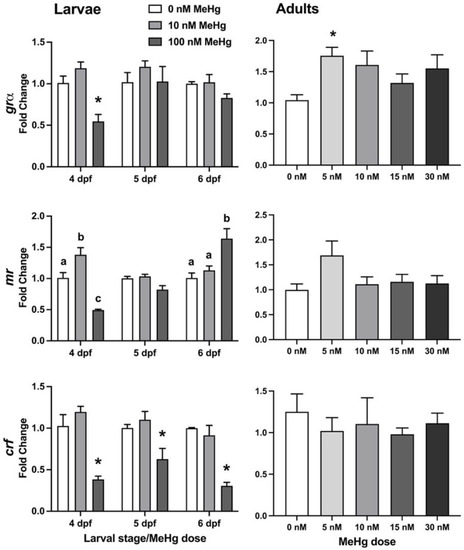
HPI-axis gene expression in larvae (left column) and adult brains (right column). Relative quantification of grα (top row), mr (middle row) and crf (bottom row) was measured in 4, 5, and 6 dpf larvae (left column, larval stage) and in the brains of developmentally exposed adult fish that were behaviourally tested, using RT-qPCR. β-actin was used as an internal standard. The ΔΔCt method was used to determine the fold change in gene expression. Subject numbers: larvae = 3; adult brains, 0 nM = 12–14, 5 nM = 6, 10 nM = 6, 15 nM = 7, 30 nM = 11–12. Significant differences from vehicle control are marked with an asterisk. Lower-case letters in the middle row indicate differences between means within 4 dpf and 6 dpf larvae. * p < 0.05. |
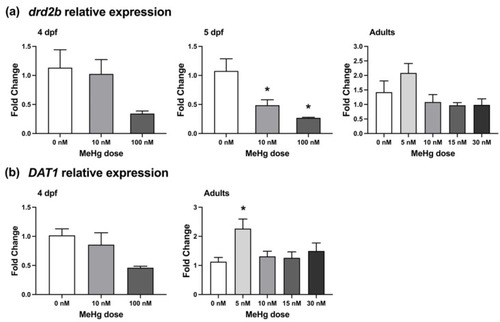
Dopamine-related gene expression in larvae and adult brains. Relative quantification of drd2b (a) and dat1 (b) was measured in 4 dpf larvae and in the brains of developmentally exposed adult fish that were behaviourally tested, using RT-qPCR. β-actin was used as an internal standard. The ΔΔCt method was used to determine the fold change in gene expression. Subject numbers: larvae = 3; adult brains, 0 nM = 13, 5 nM = 6, 10 nM = 5–6, 15 nM = 7–8, 30 nM = 11–12. Significant differences from vehicle control are marked with an asterisk. |
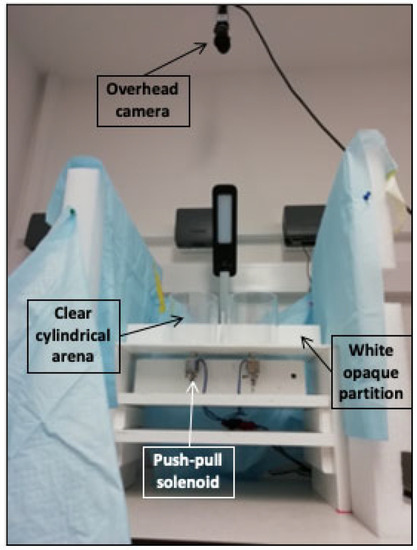
Side view of the adult tap-test experimental set-up. The apparatus was made of four clear cylindrical arenas attached to a flat white plastic surface with white opaque partitions separating the arenas. The plastic surface was placed on a wooden structure holding four push-pull solenoids centrally located under the four arenas. The apparatus was surrounded by Styrofoam sheets for visual isolation, and video recorded from above. |