
|
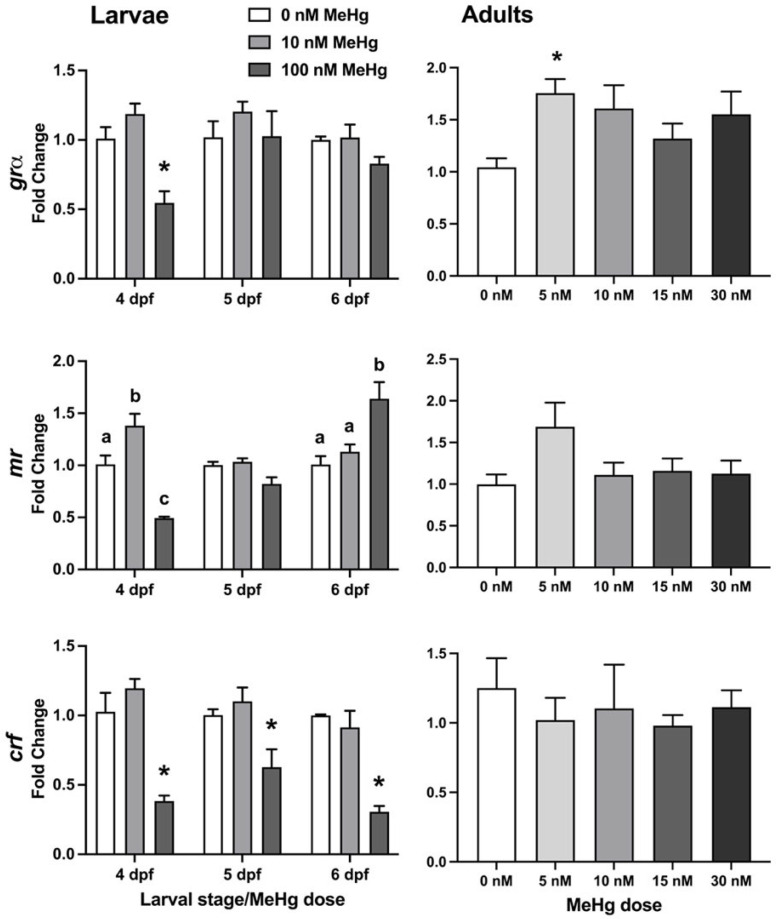
Figure 5 HPI-axis gene expression in larvae (left column) and adult brains (right column). Relative quantification of grα (top row), mr (middle row) and crf (bottom row) was measured in 4, 5, and 6 dpf larvae (left column, larval stage) and in the brains of developmentally exposed adult fish that were behaviourally tested, using RT-qPCR. β-actin was used as an internal standard. The ΔΔCt method was used to determine the fold change in gene expression. Subject numbers: larvae = 3; adult brains, 0 nM = 12–14, 5 nM = 6, 10 nM = 6, 15 nM = 7, 30 nM = 11–12. Significant differences from vehicle control are marked with an asterisk. Lower-case letters in the middle row indicate differences between means within 4 dpf and 6 dpf larvae. * p < 0.05.