
Image
|
Figure Caption
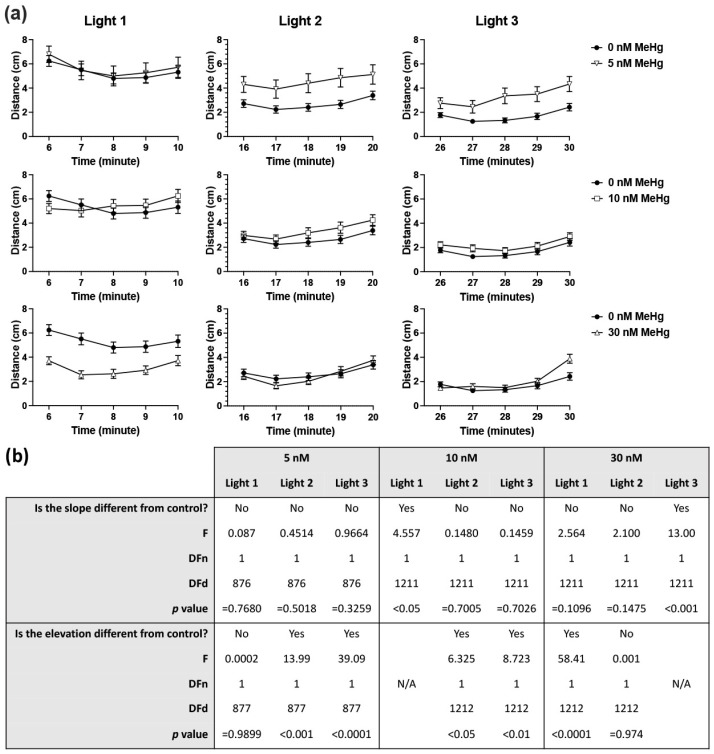
Figure 1 Six dpf larval locomotor activity in the three light phases of the light/dark locomotor activity assay and linear regression analysis. (a) Mean distance travelled per minute in each of the three light phases of the assay presented separately for each MeHg exposure dose compared to the control. (b) Linear regression analysis of difference in slope and elevation between each exposure dose and control. Subject numbers (N): 0 nM = 121; 5 nM = 55; 10 nM = 122; 30 nM = 122.
Acknowledgments
This image is the copyrighted work of the attributed author or publisher, and
ZFIN has permission only to display this image to its users.
Additional permissions should be obtained from the applicable author or publisher of the image.
Full text @ Int. J. Mol. Sci.