FIGURE SUMMARY
Title

Glucose inhibits haemostasis and accelerates diet-induced hyperlipidaemia in zebrafish larvae

Authors
Morris, S., Cholan, P.M., Britton, W.J., Oehlers, S.H.
Source
Full text @ Sci. Rep.

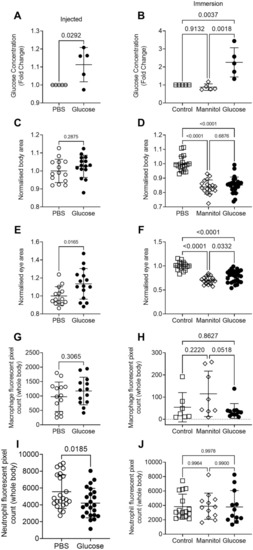
Injection and immersion methods increase glucose levels in zebrafish larvae. (A) Relative concentration of glucose in 5 dpf larvae that had been injected with 15 nmol glucose as eggs. Statistical testing by t test, each data point is representative of a group of n = 10–30 larvae. (B) Relative concentration of glucose in 5 dpf larvae immersed in 5% solutions of glucose or mannitol from 2 dpf. Statistical testing by ANOVA, each data point is representative of a group of n = 10–30 larvae. (C) Total body area calculated from lateral images of 5 dpf glucose-injected larvae. Statistical testing by t test. Data are representative of 2 biological replicates. (D) Total body area calculated from lateral images of 5 dpf larvae immersed in 5% solutions of glucose or mannitol from 2 dpf. Statistical testing by ANOVA. Data are representative of 2 biological replicates. (E) Eye area calculated from lateral images of 5 dpf glucose-injected larvae. Statistical testing by t test. Data are representative of 2 biological replicates. (F) Eye area calculated from lateral images of 5 dpf larvae immersed in 5% solutions of glucose or mannitol from 2 dpf. Statistical testing by ANOVA. Data are representative of 2 biological replicates. (G) Quantification of total macrophage number from lateral images of 5 dpf glucose-injected larvae. Statistical testing by t test. Data are representative of 2 biological replicates. (H) Quantification of total macrophage number from lateral images of 5 dpf larvae immersed in 5% solutions of glucose or mannitol from 2 dpf. Statistical testing by ANOVA. Data are representative of 2 biological replicates. (I) Quantification of total neutrophil number from lateral images of glucose-injected 5 dpf larvae. Statistical testing by t test. Data are representative of 2 biological replicates. (J) Quantification of total neutrophil number from lateral images of 5 dpf larvae immersed in 5% solutions of glucose or mannitol from 2 dpf. Statistical testing by ANOVA. Data are representative of 2 biological replicates.

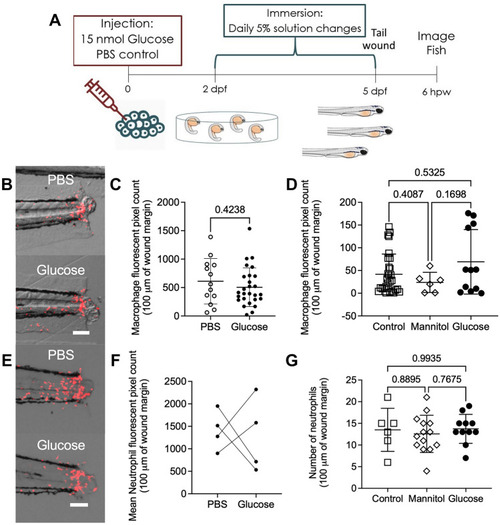
Exogenous glucose does not affect neutrophil and macrophage recruitment to a tail wound. (A) Schematic of experiment to measure immune cell recruitment to a tail wound. (B) Representative images of macrophage (red) recruitment to a tail wound in glucose-injected larvae. (C) Quantification of macrophage recruitment following tail transection in the glucose injection model. (D) Quantification of macrophage recruitment following tail transection in the glucose immersion model. (E) Representative images of neutrophil (red) recruitment to a tail wound in glucose-injected larvae. (F) Quantification of neutrophil recruitment following tail transection in the glucose injection model. Each paired data point represents the average of an biological replicate with n > 10 embryos per condition. (G) Quantification of neutrophil recruitment following tail transection in the glucose immersion model. Scale bars represent 100 μm. Statistical testing by t test. Data are representative of 3 biological replicates.

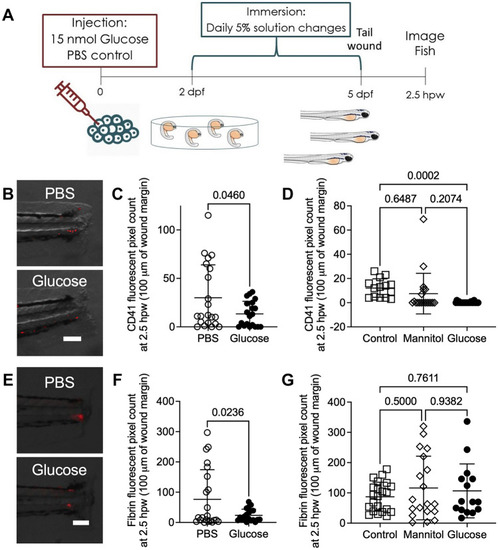
Exogenous glucose supplementation reduced thrombocyte and fibrin accumulation at a tail wound. (A) Schematic of experiment to visualise haemostasis following tail transection. (B) Representative overlay of thrombocytes (red) at 2.5 h after tail transection in glucose-injected larvae. (C) Quantification of thrombocyte plug size following tail transection in the glucose injection model. (D) Quantification of thrombocyte plug size following tail transection in the glucose immersion model. (E) Representative images of fibrinogen deposition (red) at 2.5 h after tail transection in glucose-injected larvae. (F) Quantification of fibrin clot size following tail transection in the glucose injection model. (G) Quantification of fibrin clot size following tail transection in the glucose immersion model. Scale bars represent 100 μm. Statistical testing by t test. Data are representative of 3 biological replicates.

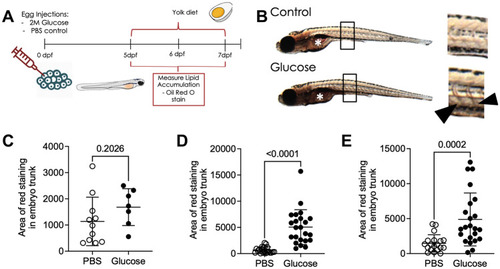
Glucose-injected larvae have increased lipid accumulation following a high fat diet. (A) Schematic of the high fat feeding challenge assay to measure lipid accumulation in glucose-injected larvae. (B) Bright field images of 6 dpf Oil Red O-stained larvae, demonstrating darker vascular staining in glucose-injected larvae. Box indicates location of inset, arrowheads indicate stained intersegmental vessels in inset, asterisk indicates intestinal lumen which was excluded from analysis. (C) Quantification of lipid accumulation in 5 dpf glucose-injected larvae. (D) Quantification of lipid accumulation in 6 dpf glucose-injected larvae challenged with a high fat diet from 5 dpf. (E) Quantification of lipid accumulation in 7 dpf glucose-injected larvae challenged with a high fat diet from 5 dpf. Statistical testing by t test. Data are representative of 2 biological replicates.

Acknowledgments
This image is the copyrighted work of the attributed author or publisher, and ZFIN has permission only to display this image to its users. Additional permissions should be obtained from the applicable author or publisher of the image. Full text @ Sci. Rep.