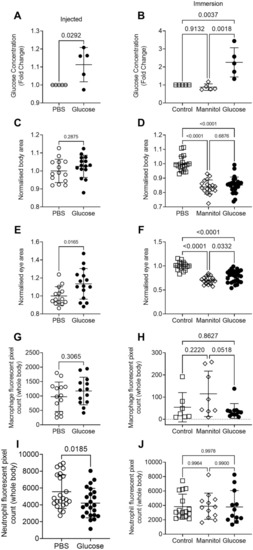
Injection and immersion methods increase glucose levels in zebrafish larvae. (A) Relative concentration of glucose in 5 dpf larvae that had been injected with 15 nmol glucose as eggs. Statistical testing by t test, each data point is representative of a group of n = 10–30 larvae. (B) Relative concentration of glucose in 5 dpf larvae immersed in 5% solutions of glucose or mannitol from 2 dpf. Statistical testing by ANOVA, each data point is representative of a group of n = 10–30 larvae. (C) Total body area calculated from lateral images of 5 dpf glucose-injected larvae. Statistical testing by t test. Data are representative of 2 biological replicates. (D) Total body area calculated from lateral images of 5 dpf larvae immersed in 5% solutions of glucose or mannitol from 2 dpf. Statistical testing by ANOVA. Data are representative of 2 biological replicates. (E) Eye area calculated from lateral images of 5 dpf glucose-injected larvae. Statistical testing by t test. Data are representative of 2 biological replicates. (F) Eye area calculated from lateral images of 5 dpf larvae immersed in 5% solutions of glucose or mannitol from 2 dpf. Statistical testing by ANOVA. Data are representative of 2 biological replicates. (G) Quantification of total macrophage number from lateral images of 5 dpf glucose-injected larvae. Statistical testing by t test. Data are representative of 2 biological replicates. (H) Quantification of total macrophage number from lateral images of 5 dpf larvae immersed in 5% solutions of glucose or mannitol from 2 dpf. Statistical testing by ANOVA. Data are representative of 2 biological replicates. (I) Quantification of total neutrophil number from lateral images of glucose-injected 5 dpf larvae. Statistical testing by t test. Data are representative of 2 biological replicates. (J) Quantification of total neutrophil number from lateral images of 5 dpf larvae immersed in 5% solutions of glucose or mannitol from 2 dpf. Statistical testing by ANOVA. Data are representative of 2 biological replicates.
|
