IMAGE

Figure 3

ID
ZDB-IMAGE-211001-4
Source
Figures for Morris et al., 2021
Image
Figure Caption

Figure 3

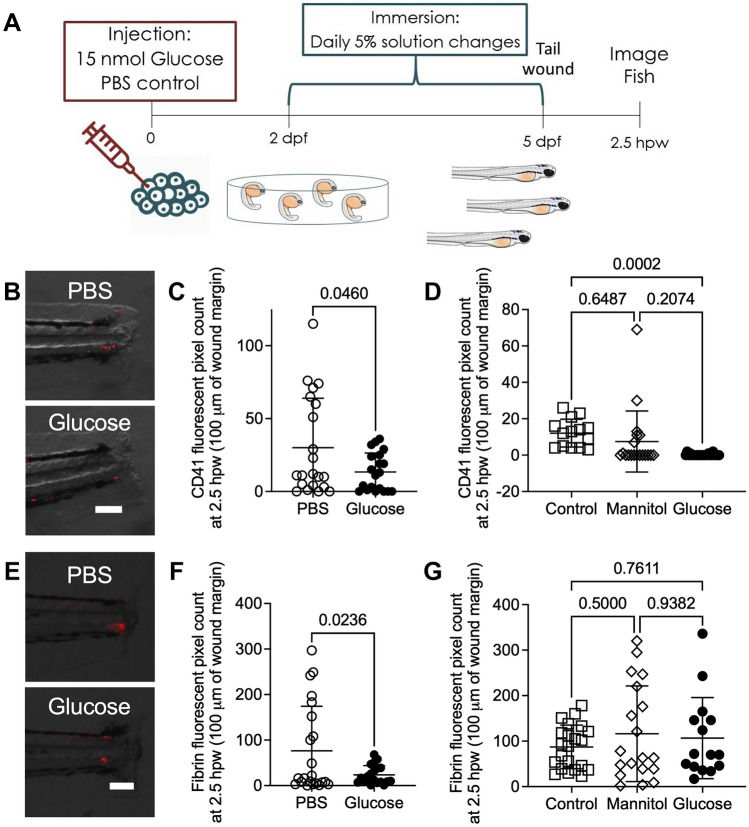
Exogenous glucose supplementation reduced thrombocyte and fibrin accumulation at a tail wound. (A) Schematic of experiment to visualise haemostasis following tail transection. (B) Representative overlay of thrombocytes (red) at 2.5 h after tail transection in glucose-injected larvae. (C) Quantification of thrombocyte plug size following tail transection in the glucose injection model. (D) Quantification of thrombocyte plug size following tail transection in the glucose immersion model. (E) Representative images of fibrinogen deposition (red) at 2.5 h after tail transection in glucose-injected larvae. (F) Quantification of fibrin clot size following tail transection in the glucose injection model. (G) Quantification of fibrin clot size following tail transection in the glucose immersion model. Scale bars represent 100 μm. Statistical testing by t test. Data are representative of 3 biological replicates.

Acknowledgments
This image is the copyrighted work of the attributed author or publisher, and ZFIN has permission only to display this image to its users. Additional permissions should be obtained from the applicable author or publisher of the image. Full text @ Sci. Rep.