
- Title
-
Promotion effect of microcystin-LR on liver tumor progression in krasV12 transgenic zebrafish following acute or subacute exposure
- Authors
- Mao, Y., Zong, Z., Dang, Y., Yu, L., Liu, C., Wang, J.
- Source
- Full text @ Ecotoxicol. Environ. Saf.
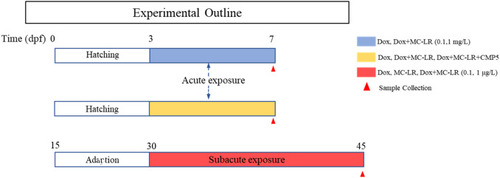
Outline of acute exposure and subacute exposure. |
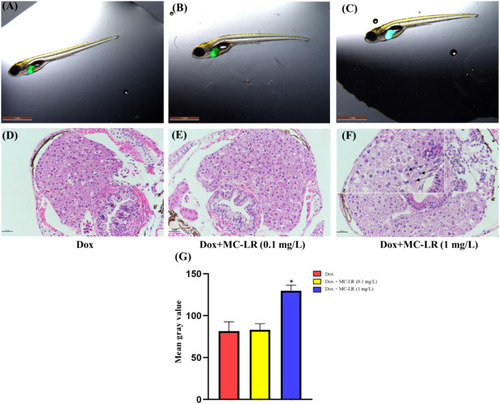
KrasV12 zebrafish larvae were exposed to a binary mixture of Dox with different concentrations of MC-LR for 4 d. (A)–(C): Liver size of krasV12 zebrafish larvae (A: Dox group, B: Dox + 0.1 mg/L MC-LR, C: Dox + 1 mg/L MC-LR. (D)–(F): Histopathological changes in the larval liver. Evidence of HCC is indicated by black arrows. Scale bar, 100 µm. (D: Dox group, E: Dox + 0.1 mg/L MC-LR, F: Dox + 1 mg/L MC-LR). G: Mean gray value (intensity/area) of krasV12 zebrafish (n = 9). The significance of the differences between the control (Dox) and exposure groups (Dox + MC-LR) was evaluated using one-way ANOVA, followed by Tukey’s range test. * p < 0.05. |
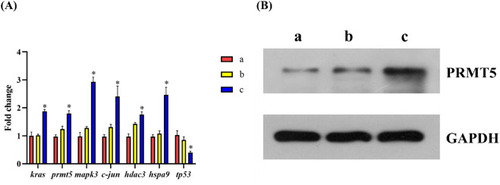
Expression levels of kras and the genes and proteins associated with HCC after MC-LR exposure determined using qRT-PCR and western blotting. (A): Expression levels of kras and the genes associated with HCC in zebrafish larvae after acute MC-LR exposure (a: Dox; b: 20 mg/L Dox + 0.1 mg/L MC-LR; c: 20 mg/L Dox + 1 mg/L MC-LR) (n = 6). (B): Western blotting analysis of Prmt5 expression (a: Dox; b: 20 mg/L Dox + 0.1 mg/L MC-LR; c: 20 mg/L Dox + 1 mg/L MC-LR) (n = 3). The significance of the differences between the control and exposure groups was evaluated using one-way ANOVA, followed by Tukey’s range test. * p < 0.05. |
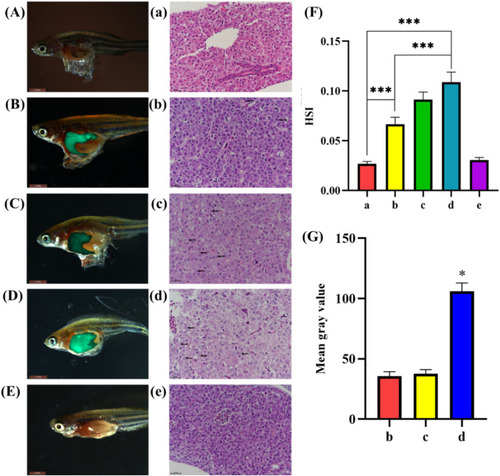
Progression of hepatocarcinogenesis induced by Dox in krasV12 zebrafish after MC-LR exposure. (A)– (E): Representative liver morphology pictures of krasV12 zebrafish. Scale bar, 2 mm (A/a: control; B/b: Dox; C/c: Dox + MC-LR (0.1 μg/L); D/d: Dox + MC-LR (1 μg/L); E/e: MC-LR (1 μg/L). Evidence of HCC (lost hepatocyte plates, large and variable nuclear size, and presence of multiple nucleoli) is indicated by the black arrows. Scale bar, 50 µm. (F) and (G): Effects of MC-LR on HSI values and mean gray values in krasV12 zebrafish liver (n = 8). Values are mean ± S.E. |
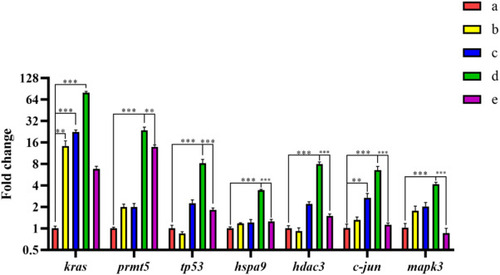
Relative mRNA expression levels of kras and genes associated with HCC in zebrafish exposed to MC-LR and Dox for 15 days (n = 6). Abbreviations: a: control; b: Dox group; c: Dox + MC-LR (0.1 μg/L); d: Dox + MC-LR (1 μg/L); e: MC-LR group. Values are the mean ± S.E. The significance of differences between control and exposure groups was evaluated using one-way ANOVA, followed by Tukey’s range test. * p < 0.05, * * p < 0.01, * ** p < 0.001. |
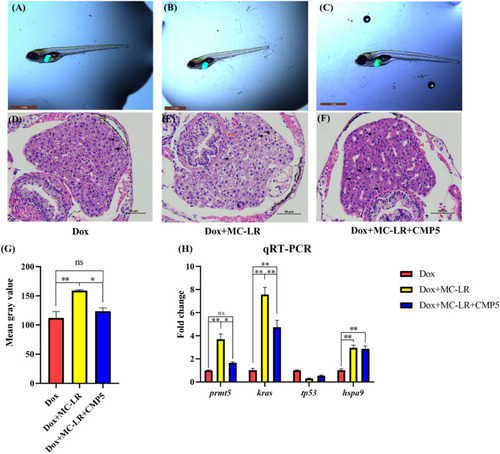
Exposure to a ternary mixture of 1 mg/L MC-LR, 20 mg/L Dox, and 20 µM CMP5 significantly decreased the prmt5 expression and mean gray value (intensity/area) in krasV12 zebrafish larvae. (A)– (C): Representative pictures of zebrafish treated with 20 mg/L Dox, 1 mg/L MC-LR + 20 mg/L Dox, and 1 mg/L MC-LR + 20 mg/L Dox + 20 µM CMP5. Scale bar, 1 mm. (D)–(F): Representative histological images of krasV12 zebrafish liver. Scale bar, 50 µm. (G): Mean gray value (intensity/area) of krasV12 zebrafish larvae (n = 9). (H): Expression levels of the genes associated with tumor progression (n = 6). The significance of differences between control and exposure groups was evaluated using one-way ANOVA, followed by Tukey’s range test. Values are mean ± S.E. * p < 0.05, * * p < 0.01, * ** p < 0.001. |