
|
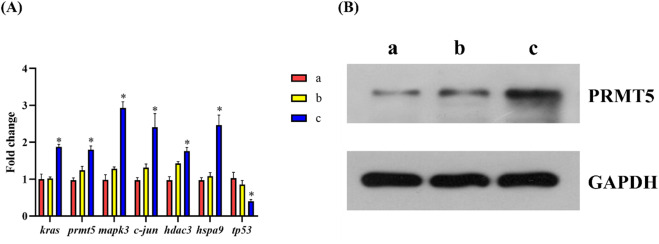
Fig. 3 Expression levels of kras and the genes and proteins associated with HCC after MC-LR exposure determined using qRT-PCR and western blotting. (A): Expression levels of kras and the genes associated with HCC in zebrafish larvae after acute MC-LR exposure (a: Dox; b: 20 mg/L Dox + 0.1 mg/L MC-LR; c: 20 mg/L Dox + 1 mg/L MC-LR) (n = 6). (B): Western blotting analysis of Prmt5 expression (a: Dox; b: 20 mg/L Dox + 0.1 mg/L MC-LR; c: 20 mg/L Dox + 1 mg/L MC-LR) (n = 3). The significance of the differences between the control and exposure groups was evaluated using one-way ANOVA, followed by Tukey’s range test. * p < 0.05.