
|
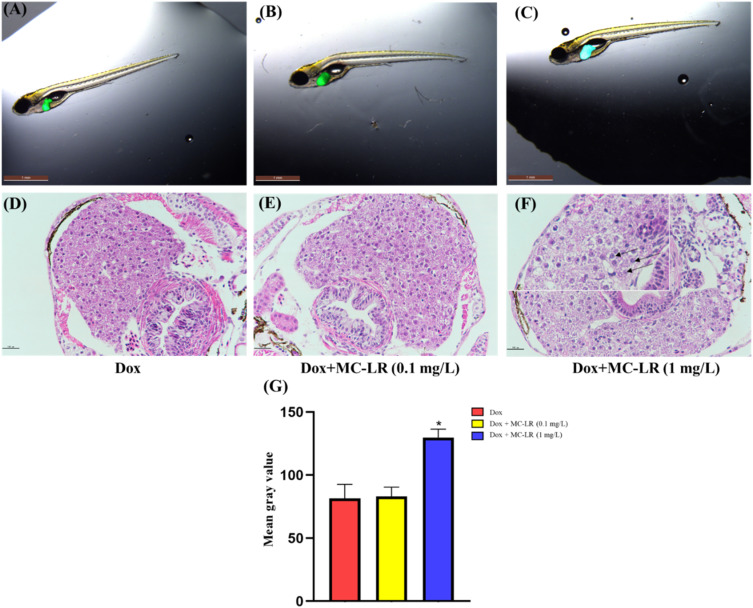
Fig. 2 KrasV12 zebrafish larvae were exposed to a binary mixture of Dox with different concentrations of MC-LR for 4 d. (A)–(C): Liver size of krasV12 zebrafish larvae (A: Dox group, B: Dox + 0.1 mg/L MC-LR, C: Dox + 1 mg/L MC-LR. (D)–(F): Histopathological changes in the larval liver. Evidence of HCC is indicated by black arrows. Scale bar, 100 µm. (D: Dox group, E: Dox + 0.1 mg/L MC-LR, F: Dox + 1 mg/L MC-LR). G: Mean gray value (intensity/area) of krasV12 zebrafish (n = 9). The significance of the differences between the control (Dox) and exposure groups (Dox + MC-LR) was evaluated using one-way ANOVA, followed by Tukey’s range test. * p < 0.05.