
FIGURE
Fig. 5
- ID
- ZDB-FIG-240702-117
- Publication
- Mao et al., 2021 - Promotion effect of microcystin-LR on liver tumor progression in krasV12 transgenic zebrafish following acute or subacute exposure
- Other Figures
- All Figure Page
- Back to All Figure Page
Fig. 5
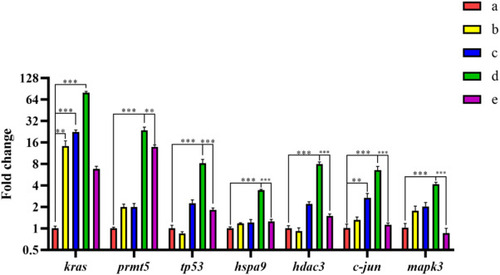
Relative mRNA expression levels of kras and genes associated with HCC in zebrafish exposed to MC-LR and Dox for 15 days (n = 6). Abbreviations: a: control; b: Dox group; c: Dox + MC-LR (0.1 μg/L); d: Dox + MC-LR (1 μg/L); e: MC-LR group. Values are the mean ± S.E. The significance of differences between control and exposure groups was evaluated using one-way ANOVA, followed by Tukey’s range test. * p < 0.05, * * p < 0.01, * ** p < 0.001. |
Expression Data
Expression Detail
Antibody Labeling
Phenotype Data
Phenotype Detail
Acknowledgments
This image is the copyrighted work of the attributed author or publisher, and
ZFIN has permission only to display this image to its users.
Additional permissions should be obtained from the applicable author or publisher of the image.
Full text @ Ecotoxicol. Environ. Saf.