
Image
|
Figure Caption
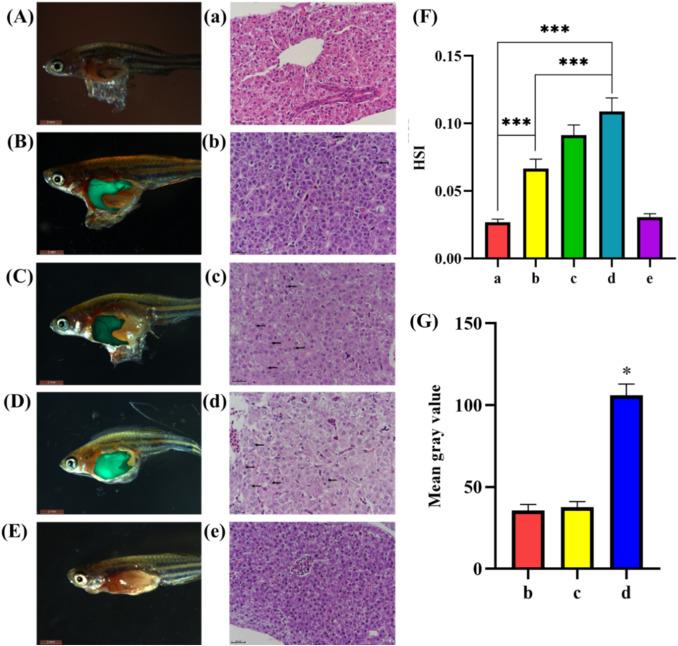
Fig. 4 Progression of hepatocarcinogenesis induced by Dox in krasV12 zebrafish after MC-LR exposure. (A)– (E): Representative liver morphology pictures of krasV12 zebrafish. Scale bar, 2 mm (A/a: control; B/b: Dox; C/c: Dox + MC-LR (0.1 μg/L); D/d: Dox + MC-LR (1 μg/L); E/e: MC-LR (1 μg/L). Evidence of HCC (lost hepatocyte plates, large and variable nuclear size, and presence of multiple nucleoli) is indicated by the black arrows. Scale bar, 50 µm. (F) and (G): Effects of MC-LR on HSI values and mean gray values in krasV12 zebrafish liver (n = 8). Values are mean ± S.E.
Acknowledgments
This image is the copyrighted work of the attributed author or publisher, and
ZFIN has permission only to display this image to its users.
Additional permissions should be obtained from the applicable author or publisher of the image.
Full text @ Ecotoxicol. Environ. Saf.