
- Title
-
6-Gingerol, a Major Constituent of Zingiber officinale Rhizoma, Exerts Anticonvulsant Activity in the Pentylenetetrazole-Induced Seizure Model in Larval Zebrafish
- Authors
- Gawel, K., Kukula-Koch, W., Banono, N.S., Nieoczym, D., Targowska-Duda, K.M., Czernicka, L., Parada-Turska, J., Esguerra, C.V.
- Source
- Full text @ Int. J. Mol. Sci.
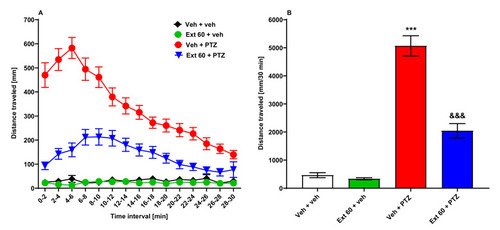
The influence of Zingiber officinale rhizoma methanolic extract on seizure-like behavior in the PTZ-induced hyperlocomotion assay in zebrafish. After 24 h incubation in Zingiber officinale rhizoma methanolic extract (60 µg/mL), 7-day-old zebrafish larvae were exposed to an acute dose of PTZ (20 mM). Larval behavior was assessed 5 min after PTZ application. Results of the experiment are depicted as: (A) distance covered by larvae in 2 min long time bins, and (B) total distance covered by larvae during 30 min of the assay. Data were analyzed using one-way or two-way ANOVA with repeated measures followed by Tukey’s or Bonferroni’s post hoc test, respectively. Data are depicted as a mean ± standard error of the mean (SEM). Veh + veh (n = 31), Ext 60 + veh (n = 24), Veh + PTZ (n = 48), Ext 60 + PTZ (n = 48). *** p < 0.001 vs. Veh + veh; &&& p < 0.001 vs. Veh + PTZ. Ext 60—Zingiber officinale methanolic extract (60 µg/mL), PTZ—pentylenetetrazole, Veh—vehicle. n—refers to the total number of larvae. |
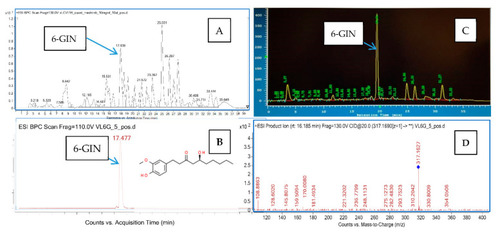
The chromatograms and fragmentation spectra obtained for the total extract and the isolated 6-GIN. (A) the total ion chromatogram of the methanolic extract from Zingiber officinale rhizome recorded in the positive ionization mode; (B) the total ion chromatogram of the isolated 6-GIN recorded in the positive ionization mode; (C) the chromatogram from the semipreparative HPLC, recorded at 290 nm; and (D) the MS/MS fragmentation spectrum of 6-GIN. |

Larvae treated with 6-GIN are morphologically indistinguishable from their Veh-treated counterparts. (A) Larva treated with Veh for 24 h (n = 9). (B) Larva treated with 37.5 µM 6-GIN for 24 h (n = 11). (C) Larva treated with 50 µM 6-GIN for 24 h (n = 11). (D) Comparison of body length of Veh- and 6-GIN-treated larvae (E) Comparison of eye length of Veh- and 6-GIN-treated larvae. Red dash lines represent how eye length was measured, scale bar = 1 mm. 6-GIN—6-gingerol, Veh—vehicle. |
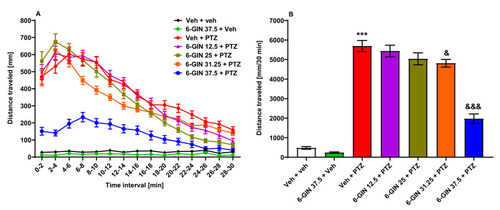
The influence of 6-GIN on the seizure-like behavior in the PTZ-induced zebrafish hyperlocomotion assay. After 24 h incubation in different doses of 6-GIN (12.5, 25, 31.25, or 37.5 µM), 7-day-old zebrafish larvae were exposed to PTZ (20 mM). Larval behavior was assessed 5 min after PTZ administration. Results of the assay are depicted as: (A) distance covered by larvae in 2 min long time bins, and (B) total distance covered by larvae during 30 min of the assay. Data were analyzed using one-way or two-way ANOVA with repeated measures followed by Tukey’s or Bonferroni’s post hoc test, respectively. Data are depicted as a mean ± SEM. Veh + veh (n = 48), 6-GIN 37.5 + Veh (n = 48), Veh + PTZ (n = 64), 6-GIN 12.5 + PTZ (n = 47), 6-GIN 25 + PTZ (n = 56), 6-GIN 31.25 + PTZ (n = 48), 6-GIN 37.5 + PTZ (n = 37). *** p < 0.001 vs. Veh + veh; &&& p < 0.001, & p < 0.05 vs. Veh + PTZ. 6-GIN—6-gingerol, PTZ—pentylenetetrazole, Veh—vehicle. n—refers to the total number of larvae. |
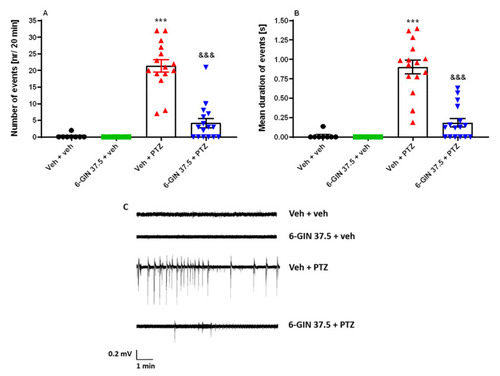
LFP events detected from the optic tectum of 7-day-old zebrafish larvae pre-exposed for 24 h to 6-GIN (37.5 µM). Subsequently, each larva was incubated with 20 mM PTZ or Veh for 5 min, before being mounted in agarose for LFP recordings. Data are shown as: (A) the number of events (nr/20 min), and (B) the mean duration of events (s/20 min). Data were analyzed using one-way ANOVA followed by Tukey’s post hoc test. Data are depicted as mean ± SEM. Veh + veh (n = 8), 6-GIN 37.5 + Veh (n = 6), Veh + PTZ (n = 14), 6-GIN 37.5 + PTZ (n = 16). *** p < 0.001 vs. Veh + veh; &&& p < 0.001 vs. Veh + PTZ. (C) Representative traces of recordings. 6-GIN—6-gingerol, PTZ—pentylenetetrazole, Veh—vehicle. n—refers to the total number of larvae. |

Determination of (A) GABA, (B) GLU, (C) GLU/GABA ratio, and (D) the total ion chromatogram (A) of the water: acetonitrile extract from zebrafish larvae with extracted ion chromatograms and MS/MS spectra of GLU and GABA in 7-day-old zebrafish larvae by HPLC-MS. After a 24 h incubation in 6-GIN (37.5 µM), zebrafish larvae were exposed to an acute dose of PTZ (20 mM) for 90 min. Next, whole zebrafish larvae were collected in a pool of n = 100/sample. Data were analyzed using one-way ANOVA followed by Tukey’s post hoc test. Data are depicted as mean ± SEM. Veh + veh (n = 9), 6-GIN 37.5 + Veh (n = 5), Veh + PTZ (n = 5), 6-GIN 37.5 + PTZ (n = 5). *** p < 0.001, ** p < 0.01, * p < 0.05 vs. Veh + veh; &&& p < 0.001 vs. Veh + PTZ. 6-GIN—6-gingerol, PTZ—pentylenetetrazole, Veh—vehicle. n—refers to the total number of samples. |

The effect of 6-GIN on (A) gabra1a, (B) grin1a, (C) grin2b, (D) gria1a, (E) gria2a, and (F) gria3b mRNA expression in PTZ-treated zebrafish larvae. After a 24 h incubation in 6-GIN (37.5 µM), zebrafish larvae were exposed to PTZ (20 mM) for 90 min. Next, zebrafish larvae were collected in a pool of n = 10/sample. mRNA levels were normalized against gapdh. Data were analyzed using one-way ANOVA with Tukey’s post hoc test. Data are depicted as a mean ± SEM (n = 3/group). *** p < 0.01, ** p < 0.01, * p < 0.05 vs. Veh + veh; && p < 0.01 vs. Veh + PTZ. 6-GIN—6-gingerol, PTZ—pentylenetetrazole, Veh—vehicle. n—refers to the total number of samples. |
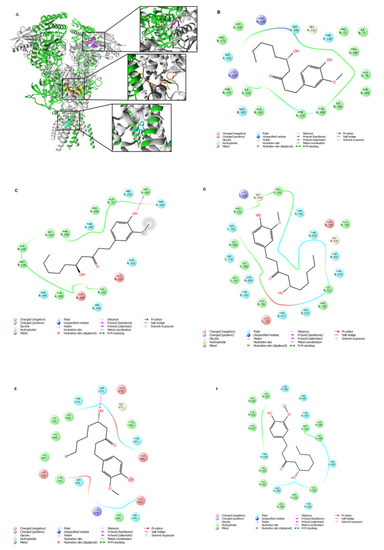
Molecular docking of 6-GIN to the GluN1/GluN2B NMDA receptor. (A) 6-GIN binding sites (surface model) are located at the ATD (magenta and purple), the LBD (yellow and orange) and the TMD (cyan) of the GluN1/GluN2B NMDA receptor. More specifically, molecular docking results suggested two different orientations of 6-GIN at ATD, a high-affinity site (magenta) located at the GluN1/GluN2B interface and a low-affinity site (purple) within the GluN2B subunit. In addition, 6-GIN may interact with the glutamate binding site (at the LBD). Orientation 1 presents a higher affinity site (orange) at the GluN1/GluN2B LBD interface, and orientation 2 presents a lower affinity pose (yellow) located within the LBD of the GluN2B subunit. Finally, the 6-GIN interacts within the ion channel (at the TMD) of the GluN1/GluN2B NMDA receptor. (B,C) 2D views of 6-GIN interacting with the high-affinity site and low-affinity site at the ATD, respectively. (D,E) 2D views of 6-GIN interacting with the higher-affinity as well as lower-affinity sites at the LBD, respectively. (F) 2D view of the 6-GIN interactions within the ion channel pore of the GluN1/GluN2B NMDA receptor. The GluN1 subunits are shown in green, and the GluN2B subunits are depicted in grey. The residues involved in 6-GIN binding are presented in panels (B–F) (2D views) and included in Table 1. Hydrogen bonds are marked with pink arrows, residues involved in hydrophobic interactions are shown in green, polar in blue, and charged residues involved in binding are shown in red. |