
IMAGE
Figure 2
- ID
- ZDB-IMAGE-210801-63
- Publication
- Gawel et al., 2021 - 6-Gingerol, a Major Constituent of Zingiber officinale Rhizoma, Exerts Anticonvulsant Activity in the Pentylenetetrazole-Induced Seizure Model in Larval Zebrafish
- All Figures
- Figures for Gawel et al., 2021
Image
|
Figure Caption
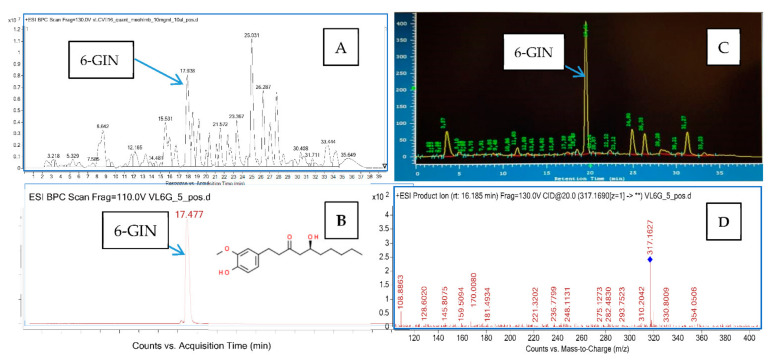
Figure 2 The chromatograms and fragmentation spectra obtained for the total extract and the isolated 6-GIN. (A) the total ion chromatogram of the methanolic extract from Zingiber officinale rhizome recorded in the positive ionization mode; (B) the total ion chromatogram of the isolated 6-GIN recorded in the positive ionization mode; (C) the chromatogram from the semipreparative HPLC, recorded at 290 nm; and (D) the MS/MS fragmentation spectrum of 6-GIN.
Acknowledgments
This image is the copyrighted work of the attributed author or publisher, and
ZFIN has permission only to display this image to its users.
Additional permissions should be obtained from the applicable author or publisher of the image.
Full text @ Int. J. Mol. Sci.