
- Title
-
Using Zebrafish to Elucidate Glial-Vascular Interactions During CNS Development
- Authors
- Umans, R.A., Pollock, C., Mills, W.A., Clark, K.C., Pan, Y.A., Sontheimer, H.
- Source
- Full text @ Front Cell Dev Biol

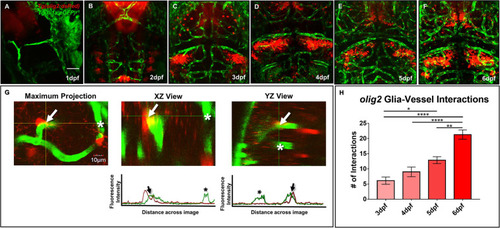
Glial expression increases during zebrafish brain development with distinct lineages. |
Zebrafish migratory |
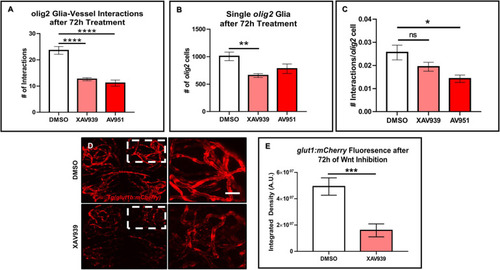
Wnt inhibition decreases |

Zebrafish |
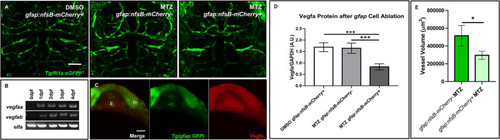
Ablation of |
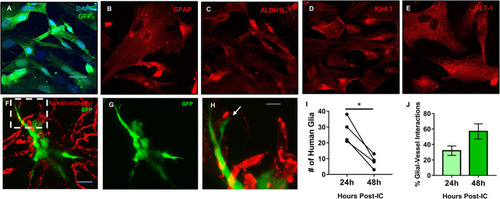
Mature human astrocytes contact developing zebrafish brain vessels. |