
Image
|
Figure Caption
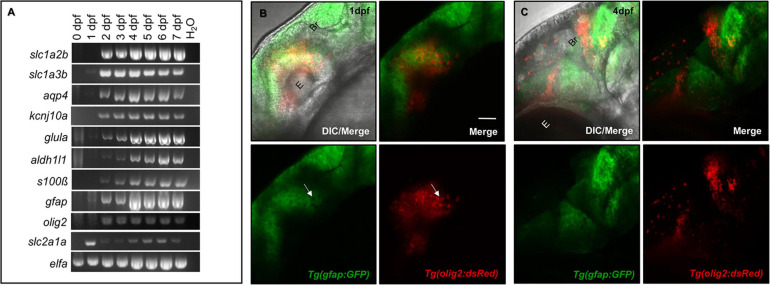
FIGURE 1
Glial expression increases during zebrafish brain development with distinct lineages.
Acknowledgments
This image is the copyrighted work of the attributed author or publisher, and
ZFIN has permission only to display this image to its users.
Additional permissions should be obtained from the applicable author or publisher of the image.
Full text @ Front Cell Dev Biol