IMAGE

FIGURE 3

ID
ZDB-IMAGE-210718-14
Source
Figures for Umans et al., 2021
Image
Figure Caption

FIGURE 3

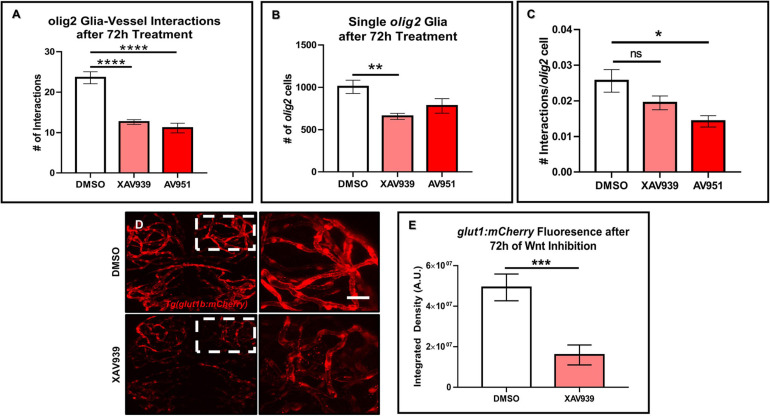
Wnt inhibition decreases olig2+ cell vessel migration and brain endothelial cell signaling. (A)Tg(olig2:dsRed;fli1a:eGFP) animals were treated for 72 h from 3 to 6 dpf with DMSO vehicle, the Wnt inhibitor, XAV939, or the Vegf inhibitor, AV951. olig2+ cell-vessel interactions were quantified after 72 h of each treatment. A one-way ANOVA with Tukey’s Multiple comparisons test was performed (****p < 0.0001). Error bars represent standard error of the mean. n = 7–8 animals per group. (B) Quantification of individual cells from animals treated in panel (A). A one-way ANOVA with Tukey’s Multiple comparisons test was performed (**p < 0.005). Error bars represent standard error of the mean. n = 6–7 animals per group. (C) Quantification of the total number of olig2+ cell-vessel interactions divided by total number of olig2+ cells per condition. A one-way ANOVA with Tukey’s Multiple comparisons test was performed (*p < 0.005). Error bars represent standard error of the mean. n = 10 animals per group. (D) Representative live confocal images of Tg(glut1b:mCherry) animals treated with either DMSO vehicle control or XAV939 from 3 to 6 dpf. The right panels are the zoomed in areas from the corresponding white boxes in the left panels. Scale bar = 20 μm. (E) Quantification of glut1b:mCherry fluorescence after 72 h of XAV939 treatment. A two-tailed, unpaired t-test was performed (***p < 0.001). Error bars represent standard error of the mean. n = 9–11 animals per group.

Acknowledgments
This image is the copyrighted work of the attributed author or publisher, and ZFIN has permission only to display this image to its users. Additional permissions should be obtained from the applicable author or publisher of the image. Full text @ Front Cell Dev Biol