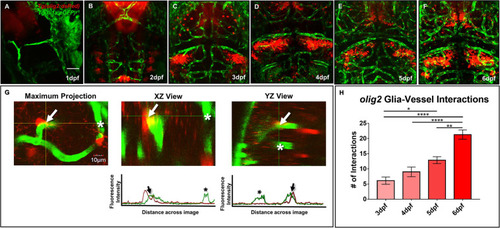
Zebrafish migratory olig2+ glia expand during CNS angiogenesis and co-opt the developing vascular network. (A–F) Daily live confocal images of the Tg(olig2:dsRed) line (red) crossed to the Tg(fli1a:eGFP)y1 line (green) from 1 to 6 dpf. Red olig2+ glia move out from the ventral brain and migrate along green blood vessels during brain development. Scale bar = 50 μm. (G) A representative maximum intensity projection of a single olig2+ cell (red) sitting on a vessel (green) in the developing zebrafish forebrain (left panel). The orthogonal horizontal (XZ) and vertical (YZ) views (middle and right panel) from the crosshairs where the olig2+ cell sits on a vessel. The orthogonal views are displayed above their corresponding fluorescence line profiles whereby an arrow denotes an olig2+ -vessel interaction and an asterisk shows signal from a nearby vessel without an olig2+ cell. Scale bar = 10 μm. (H)olig2+-vessel interactions quantified from 3 to 6 dpf. A one-way ANOVA with Tukey’s Multiple comparisons test was performed. *p ≤ 0.05, **p ≤ 0.005, ****p ≤ 0.0001. Error bars represent standard error of the mean. n = 7–11 per group.
|
