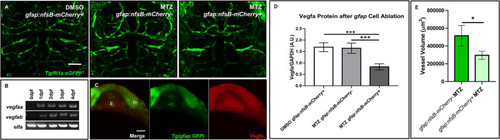
Ablation of gfap glia impairs CNS angiogenesis via a reduction in Vegfa. (A) Live confocal images of 3 dpf animals in the following treatment groups; gfap:nfsB-mCherry+ treated with DMSO treated (left), gfap:nfsB-mCherry- treated with MTZ (middle), and gfap:nfsB-mCherry+ treated with MTZ (right). MTZ treatment in the transgene containing group reduces vessel outgrowth in the brain. n = 6–11 animals per group. (B) RT-PCR of Vegfa isoforms during 0–4 dpf development. (C) WMIHC of 1 dpf Tg(gfap:GFP) (green) stained for Vegfa protein (red). Vegfa is widely expressed during gfap cell development. E, eye. Br, brain. (D) Western blot analysis of Vegfa protein levels in the same treatment groups in (A). A two-way ANOVA with Tukey’s Multiple comparisons test was performed (***p < 0.0005). Error bars represent standard error of the mean. n = 5 biological replicates/groups per condition. (E) Volumetric analysis of vessels from non-transgenic control siblings treated with MTZ (left) show a reduction in vessel volume in transgenic animals treated with MTZ (right). A one-tailed, unpaired t-test was performed (*p < 0.05). Error bars represent standard error of the mean. n = 8–9 animals per group.
|
