
- Title
-
Histopathological assessment of laterality defects in zebrafish development
- Authors
- Chowdhury, M.A.U., Raslan, A.A., Lee, E., Eum, J., Hwang, B.J., Kwon, S.H., Kee, Y.
- Source
- Full text @ Animal Cells Syst (Seoul)

|

|
|

|

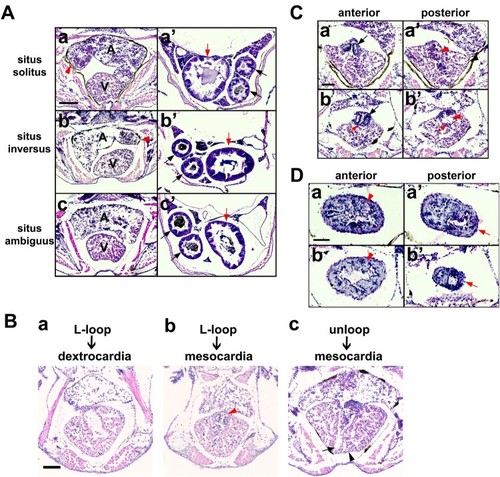
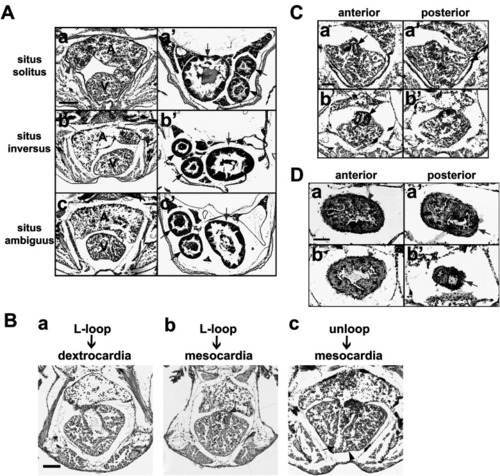
Situs solitus, situs inversus, and situs ambiguus in zebrafish visceral organ development (A) Whole mount double in situ hybridization reveals laterality of the developing liver (arrow) using a foxa3 RNA probe (purple) in the dorsal view of control (a) and experimental embryos (b–d) and the cardiac looping using the myocardial marker myl7 (brown) in the ventral view of control (a’) and experimental embryos (b’–d’). A, atrium; V, ventricle. Scale bars, 150 µm. (B) Ventral views of 6 dpf larvae stained with Streptavidin-Cy3 (Strep-Cy3) to visualize situs solitus (a), situs inversus (b), and situs ambiguus (c) of the heart (black arrow), liver (white arrow) and gut (yellow arrow). Scale bar, 150 µm. |

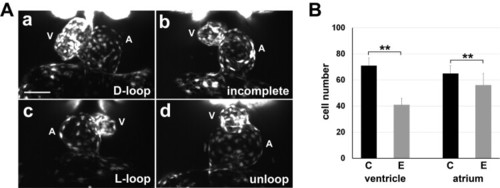
Disruption of the nodal signalling and left-right organizer development in zebrafish embryos in the experimental conditions of over-crosses and temporary cold shock during early development. (A) In situ hybridization reveals defect in nodal signalling. Asymmetrical expressions of dand5, spaw and lft2 are often randomized in the experimental embryos (b-d, b’-d’, and b”-d”) compared to controls (a, a’, and a”) respectively. B, bilateral; L, left-sided; R, right-sided; S, symmetrical. Scale bars, 150 µm. (B) The experimental condition causes reduced size of the Kuffer’s vesicle and lower number of cilia. (a-c) Confocal imaging showing primary cilia (green) labelled with an anti-acetylated α-tubulin (Ac-a-tubulin) antibody, Kuffer’s vesicle (yellow dotted circle), and the nuclei of neighbouring cells (red, SYTO17 staining). Scale bar, 20 µm. (d-f) Organizer size, cilia number and the cilia length were compared between the control (C) and experimental embryos (E). Statistical difference between groups was evaluated by the Student’s t-test. **P< .0005. |

|

|
|
|