
- Title
-
β-Cell pre-miR-21 Induces Dysfunction and Loss of Cellular Identity by Targeting Transforming Growth Factor Beta 2 (Tgfb2) and Smad Family Member 2 (Smad2) mRNAs
- Authors
- Ibrahim, S., Johnson, M., Stephens, C.H., Xu, J., Moore, R., Mariani, A., Contreras, C., Syed, F., Mirmira, R.G., Anderson, R.M., Sims, E.K.
- Source
- Full text @ Mol Metab
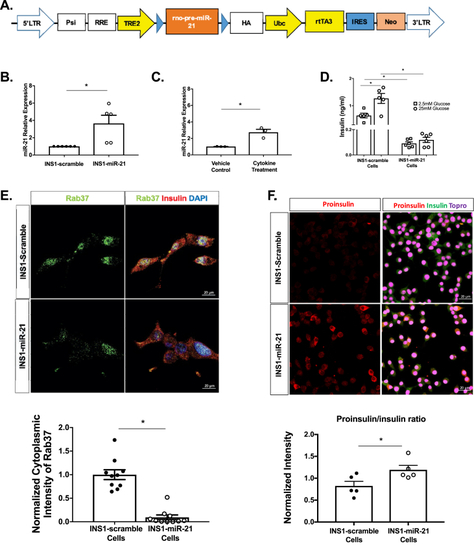
β-cell miR-21 induction results in impaired function. (A) Construct for the miR-21 overexpressing lentiviral system (LTR=long terminal repeat, Psi=packaging signal, RRE=rev response element, TRE2=tetracycline response element, Ubc=ubiquitin, HA=tag protein, rtTA3=reverse tetracycline trans-activator, IRES=internal ribosome entry site, Neo=Neomycin cassette). (B) miR-21 induction in 48 h 5 ug/ml doxycycline-treated INS1-miR-21 cells vs. INS1-scramble control cells. (C) miR-21 induction following 24 h of 5 ng/ml IL1β treatment in INS1 cells. (D) Baseline and glucose-stimulated insulin secretion were decreased in INS1-miR-21 cells as compared to INS1-scramble cells. (E) Cytoplasmic staining for the granule marker Rab37 (a marker of secretory granules) was decreased in INS1-miR-21 cells. (F) Proinsulin to insulin ratio was increased in INS1-miR-21 cells based on quantification of staining for proinsulin and insulin. Signal intensity from experimental images was normalized to signal intensity from control images, giving a relative expression for all cell staining experiments. n = 3–12 (4–5 transductions of cells); ∗p < 0.05. |
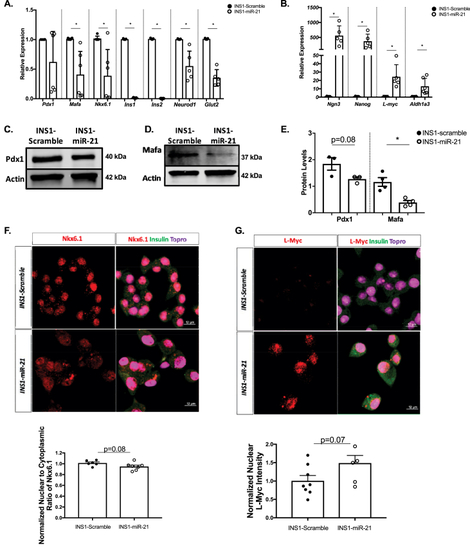
RT-PCR analysis and staining of INS1-miR-21 cells identify reduced expression of genes impacting β-cell function and identity. (A) The qRT-PCR analysis demonstrated that transcripts for MafA, Nkx6.1, Ins1, Ins2, Neurod1, and Glut2, were all decreased after miR-21 induction in INS1-miR-21 cell lines. (B) The qRT-PCR analysis determined that transcripts for β-cell progenitor markers Ngn3, Nanog, L-myc, and a gene associated with β-cell dysfunction in the context of dedifferentiation, Aldh1a3, were all increased after miR-21 induction in INS1-miR-21 cell lines. Western blot analysis and quantification demonstrated a trend toward a decrease in the levels of Pdx1 and significantly decreased levels of MafA (C–E). (F) Staining for Nkx6.1 showed a trend towards a decrease in the nuclear to cytoplasmic ratio in INS1-miR-21 cells as compared to controls. (G)Staining for L-Myc demonstrated a trend toward an increase in nuclear expression in INS1-miR-21 cell lines. n = 3–9 (3–4 transductions of cells); ∗p < 0.05. |
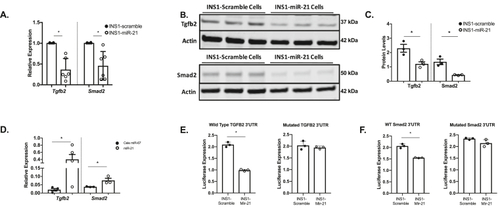
INS1-miR-21 cells directly target the Tgfb2 pathway. (A) The qRT-PCR analysis demonstrated that transcripts for Tgfb2 and Smad2 were decreased after miR-21 induction in INS1-miR-21 cells. (B–C) Western blot analysis showed decreased Tgfb2 and Smad2 protein expression in miR-21 induced INS1-miR-21 cells. (D)Tgfb2 and Smad2 mRNAs were enriched in the miR-21 biotinylated pulldown samples normalized to cell lysate and compared to C-elegans control miR-67 biotinylated mimic pulldown. (E–F): Luciferase assays showed that activity was decreased after miR-21 induction in cells expressing wild type 3′UTR, but not in cells expressing the mutated 3′UTR for (E)Tgfb2 and (F) Smad2. n = 3–6; ∗p < 0.05. |
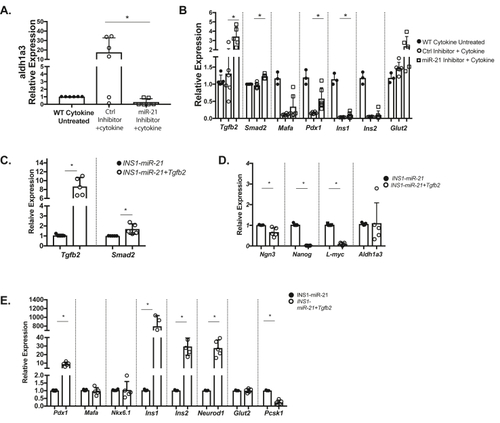
Inhibition of miR-21 in INS1 cells blocks the effects of inflammatory cytokines on β-cell identity and overexpression of Tgfb2 ameliorates effects of miR-21 on β-cells. Compared to 24-h treatment with IL1- β alone, pretreatment with a miR-21 inhibitor resulted in (A) reduced Aldh1a3 expression. (B) Cytokine-induced reductions in Tgfb2 and Smad2, Pdx1, and Ins1 were also abrogated by pre treatment with a miR-21 inhibitor, with a trend toward an increase in levels of MafA, Ins2, and Glut2. Wild-type cytokine untreated results are shown for comparison, with statistical comparisons performed between the cytokine-treated control inhibitor and miR-21 inhibitor groups. (C) The qRT-PCR analysis demonstrated that transcripts for Tgfb2 and Smad2 are increased in INS1-miR-21 cells treated with a Tgfb2 overexpression vector as compared to INS1-miR-21 control cells. (D) Overexpression of Tgfb2 resulted in decreased expression of β-cell progenitor markers Ngn3, Nanog, and L-myc in INS1-miR-21 cells. (E) Overexpression of Tgfb2 also resulted in increased expression of Pdx1, Ins1, Ins2, and Neurod1. n = 3–5; ∗p < 0.05. |
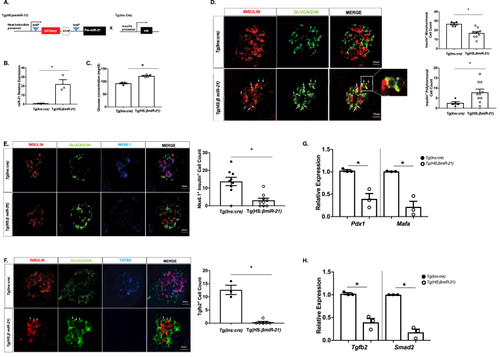
A zebrafish model of β-cell-specific miR-21 induction exhibits hyperglycemia, increased bihormonal cells, decreased expression of β-cell identity markers, and reduced expression of Tgfb2 and Smad2 (A) Construct for the Tg(HS:miR-21) line and breeding strategy to develop Tg(HS:βmiR-21) fish. In all experiments, Tg(HS:βmiR-21) tissues were compared to samples from clutch-mate Tg(Ins:cre) controls. (B) miR-21 levels are increased in Tg(HS:miR-21) islets. (C) Systemic glucose levels were increased after miR-21 induction. (D) A decrease in insulin+ cells and an increase in insulin+ glucagon+ co-positive cells (examples shown with white arrows) were observed in islets from miR-21 induced embryos. (E) Levels of Nkx6.1 are decreased within the nuclei of miR-21 induced larvae. (F) A decrease in Tgfb2+ cells was observed in islets of Tg(HS:miR-21) embryos. White arrows highlight insulin+ glucagon+ co-positive cells. (G) RT-PCR demonstrated reduced mRNA expression of MafA and Pdx1 in islets isolated from Tg(HS:miR-21) embryos. (H) Expression of Tgfb2 and Smad2 mRNAs was decreased in islets isolated from Tg(HS:miR-21) embryos. RNA from at least 3 clutches, with 15 embryos/clutch and 20 islets/clutch was used for RT-PCR analysis. n=3–10; ∗p < 0.05. |
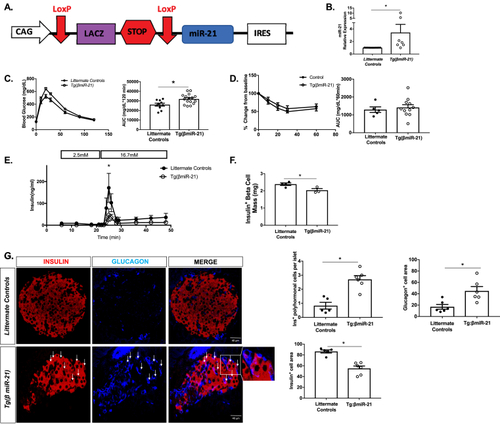
Tg(βmiR-21) mice are glucose intolerant and display a phenotype of islet β-cell dysfunction and loss of identity (A) Construct for Tg(βmiR-21) mice. For all experiments, tamoxifen-treated Tg(βmiR-21) mice were compared to tamoxifen-treated Tg(CAG-Z-miR-21-EGFP) mice and tamoxifen-treated Ins1tm1(CreERT2)Thor mice. (B) miR-21 levels are increased in islets from the Tg(βmiR-21) mice. (C) Glucose tolerance testing (GTT) showed that the Tg(βmiR-21) mice are glucose intolerant as compared to littermate controls. (D) Insulin tolerance testing (ITT) showed no differences between Tg(βmiR-21) mice and controls. (E)Ex vivo perifusion analysis showed a significant decrease in peak insulin secretion in islets from Tg(βmiR-21) mice. (F) Immunohistochemistry analysis demonstrated decreased insulin + β-cell mass in Tg(βmiR-21) mice. (G) Tg(βmiR-21) islets exhibited increased insulin+ glucagon+ co-expressing cells (white arrows). Tg(βmiR-21) islets also demonstrated an increase in glucagon+ cell area and a decrease in insulin+ cell area. n = 5–15 for metabolic testing islet RT-PCR and n = 3–4 mice for histologic analyses; ∗p < 0.05. |

Tg(βmiR-21) mouse islets display decreases in markers of β-cell identity. For all experiments, tamoxifen-treated Tg(βmiR-21) mice were compared to tamoxifen-treated Tg(CAG-Z-miR-21) mice and tamoxifen-treated Ins1tm1(CreERT2)Thor mice. Transcript levels of markers essential for β-cell identity were measured by RT-PCR (A). Decreased (B) MafA and (C) Pdx1 expression was quantified in nuclei of Insulin+ cells in Tg(βmiR-21) islets. (D) Decreased expression of Glut2 and Pcsk1 (E) were also observed in Tg(βmiR-21) islets. Levels of Aldh1a3 were increased in Tg(βmiR-21) mice as compared to littermate controls (F). Decreased expression of Tgfb2 (G) and Smad2 (H) were seen in insulin+ cells in Tg(βmiR-21) islets. (I) Immunofluorescence quantification is displayed as mean ± SEM for littermate controls and Tg(βmiR-21) mice, respectively. Immunofluorescence intensity was quantified for 3 islets per mouse for n = 3–4 mice per group; ∗p < 0.05. |

Induction of miR-21 in human islets leads to a dedifferentiated phenotype and reduced expression of mRNAs regulating β-cell identity. (A) miR-21 levels were increased in human islets transduced with the miR-21 virus as compared to human islets transduced with scramble virus (B) Levels of ALDH1A3 are increased in miR-21 induced human islets. (C) mRNA expression of PDX1, along with TGFB2 and SMAD2 was significantly decreased in human islets transduced with the miR-21 lentivirus. n = 6; ∗p < 0.05. |