
Figure 5
- ID
- ZDB-FIG-210819-5
- Publication
- Ibrahim et al., 2021 - β-Cell pre-miR-21 Induces Dysfunction and Loss of Cellular Identity by Targeting Transforming Growth Factor Beta 2 (Tgfb2) and Smad Family Member 2 (Smad2) mRNAs
- Other Figures
- All Figure Page
- Back to All Figure Page
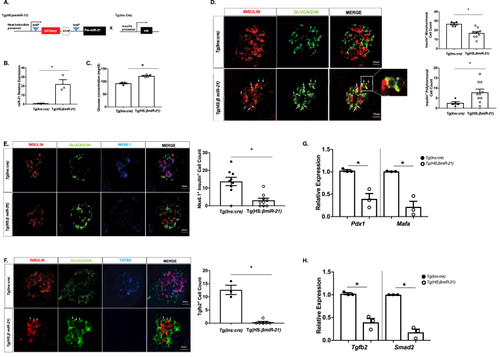
A zebrafish model of β-cell-specific miR-21 induction exhibits hyperglycemia, increased bihormonal cells, decreased expression of β-cell identity markers, and reduced expression of Tgfb2 and Smad2 (A) Construct for the Tg(HS:miR-21) line and breeding strategy to develop Tg(HS:βmiR-21) fish. In all experiments, Tg(HS:βmiR-21) tissues were compared to samples from clutch-mate Tg(Ins:cre) controls. (B) miR-21 levels are increased in Tg(HS:miR-21) islets. (C) Systemic glucose levels were increased after miR-21 induction. (D) A decrease in insulin+ cells and an increase in insulin+ glucagon+ co-positive cells (examples shown with white arrows) were observed in islets from miR-21 induced embryos. (E) Levels of Nkx6.1 are decreased within the nuclei of miR-21 induced larvae. (F) A decrease in Tgfb2+ cells was observed in islets of Tg(HS:miR-21) embryos. White arrows highlight insulin+ glucagon+ co-positive cells. (G) RT-PCR demonstrated reduced mRNA expression of MafA and Pdx1 in islets isolated from Tg(HS:miR-21) embryos. (H) Expression of Tgfb2 and Smad2 mRNAs was decreased in islets isolated from Tg(HS:miR-21) embryos. RNA from at least 3 clutches, with 15 embryos/clutch and 20 islets/clutch was used for RT-PCR analysis. n=3–10; ∗p < 0.05. |