Cloning of the full-length cDNA of Cctlr19.A A schematic diagram showing the domain architecture of common carp Tlr19. The gray box represents the signal peptide. The leucine-rich-repeat (LRR) regions are shown with green rectangles. The transmembrane (TM) domains are shown with red rectangles, and Toll/interleukin-1 receptor (TIR) domains are shown as yellow ovals. B Modeled three-dimensional structure of common carp Tlr19 shown as a cartoon. C Phylogenetic analysis of Tlr19 amino acid sequences. The phylogenetic tree was constructed using multiple alignment of amino acids generated by the neighbor-joining method in the MEGA 6.0. program. Green, black, purple, blue, red and orange color represents the TLR1, 3, 4, 5, 7 and 11 subfamilies, respectively, while the black box indicated the CcTlr19. The GenBank accession numbers of TLR sequences are shown in Additional file 1.

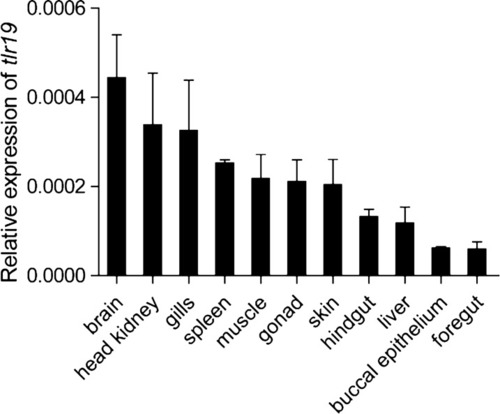
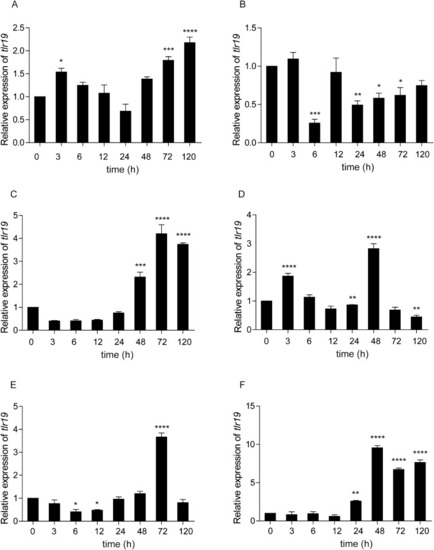
Tissue expression of Cctlr19 in normal common carp. The expression of Cctlr19 mRNA in the liver, spleen, head kidney, foregut, hindgut, skin, gills, gonad, muscle, buccal epithelium and brain was detected by qPCR. 40S ribosomal protein S11 in each tissue was amplified as an internal control, n  =  3.

Localization of CcTlr19.A For CcTlr19 colocalization with the endoplasmic reticulum, EPC cells were transiently transfected with Tlr19-GFP. After 24 h, the cells were fixed with 4% paraformaldehyde, stained with ER-Tracker, and then treated with Cy3-conjugated (red) goat anti-rabbit IgG secondary antibody (Ab). The red signal represents the ER, the green signal indicates CcTlr19, and blue staining indicates the nucleus. For CcTlr19 colocalization with endosomes, EPC cells transiently co-transfected with Tlr19-FUGW, Rab5-GFP (early endosome marker) B or Rab7-GFP (late endosome marker) C, and the cells were stained with mouse anti-FLAG antibody (Ab). The cells were treated with Cy3-conjugated secondary Ab and DAPI and then measured by immunofluorescence confocal microscopy. Red signals represent overexpressed CcTlr19, green signals display overexpressed endosomes, and blue staining indicates the nucleus.

The relative expression of Cctlr19 in various tissues of common carp after i.p. injection with A. hydrophila. The expression of Cctlr19 in the liver (A), spleen (B), head kidney (C), foregut (D), hindgut (E) and skin (F) at different time points is shown. The results were calculated relative to the expression of the 40S ribosomal protein S11 gene. Data are presented as a fold increase compared to the unstimulated control group (denoted by 0 h). Means  ±  SD (n  =  3), *P  <  0.05, **P  <  0.01, ***P  <  0.001, ****P  <  0.0001, one-way ANOVA.

The relative expression of Cctlr19 in various tissues of common carp after i.p. injection with poly(I:C). The expression of Cctlr19 in the liver (A), spleen (B), head kidney (C), foregut (D), hindgut (E) and skin (F) at different time points is shown. The results were calculated relative to the expression of the 40S ribosomal protein S11 gene. Data are presented as a fold increase compared to the unstimulated control group (denoted by 0 h). Means  ±  SD, (n  =  3), *P  <  0.05, **P  <  0.01, ***P  <  0.001, ****P  <  0.0001, one-way ANOVA.

The relative expression of Cctlr19 in the HKL of common carp after treatment with poly(I:C). (A), LPS (B), PGN (C) and flagellin (D) at different time points. The results were calculated relative to the expression of the 40S ribosomal protein S11 gene. The data are presented as a fold increase compared to the unstimulated control group (denoted by 0 h). Means  ±  SD (n  =  3), *P  <  0.05, **P  <  0.01, ****P  <  0.0001, one-way ANOVA.

Tlr19 colocalizes and interacts with TRIF.A HeLa cells transiently transfected with Tlr19-GFP and TRIF-mCherry-N1, MyD88-mCherry-N1 or TIRAP-mCherry-N1. After 24 h, the cells were fixed with 4% paraformaldehyde, stained with DAPI and subjected to confocal microscopy analysis. Green signals represent CcTlr19, red signals display adaptors, and blue staining indicates the nucleus. B 293 T cells were transfected with empty vector, Tlr19, TRIF or Tlr19  +  TRIF together with Luci-ifn and rhRL-TK reporter plasmids. After 48 h of transfection, all luciferase activities were calculated by normalization to Renilla luciferase activity, and the results are shown as the fold change compared to the control group (empty vector). Means  ±  SD (n  =  3), **P  <  0.01, ***P  <  0.001, one-way ANOVA.

Activation of ifn mediated by CcTlr19.A Luci-ifn and nf-kb reporter plasmids, rhRL-TK and CcTlr19-FUGW expression vector or an empty vector (control) were transfected into 293 T cells. After 48 h, Firefly and Renilla luciferase activities were detected, and the ratio was calculated. Means  ±  SD (n  =  4), *P  <  0.05, ***P  <  0.001, ****P  <  0.0001, t test. BD 293 T cells were transfected targeted plasmid. After 36 h, the cells were stimulated with poly(I:C), PGN and LPS for the indicated periods of time. Firefly and Renilla luciferase activities were detected, and the ratio was calculated. Means  ±  SD (n  =  4), *P  <  0.05, ***P  <  0.001, ****P  <  0.0001, two-way ANOVA.

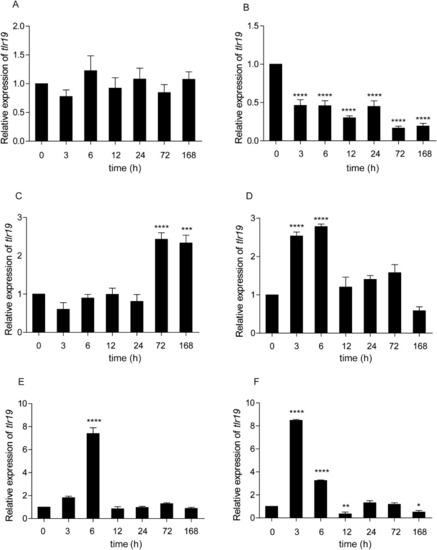
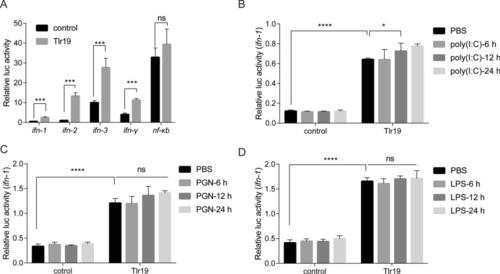
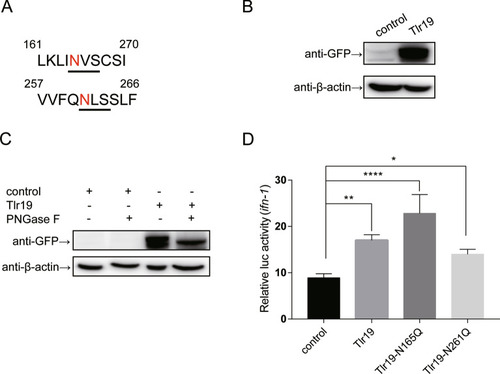
CcTlr19 induces the expression of cytokines. CcTlr19 was overexpressed in EPC cells in 24-well plates, and RNA was extracted using TRIzol. qPCR was used to test the expression of ifn-1 and viperin. The results were calculated relative to the expression of β-actin using qPCR. Mean  ±  SD (n  =  3), **P  <  0.01, ***P  <  0.001, t test.

CcTlr19 is modified with N-linked glycosylation.A N-X-S/T consensus sequence of CcTlr19. B EPC cells seeded in 6-well plates were transfected with the indicated plasmids (CcTlr19-GFP or an empty vector) separately. After 48 h, the whole-cell lysate was subjected to immunoblot assay with anti-GFP and anti-β-actin Abs. C Glycosidase digested CcTlr19. EPC cells seeded in 6-well plates were transfected with CcTlr19 or an empty vector, and the whole-cell lysate was digested with PNGase F or not (control). D A Luci-ifn-1 plasmid, rhRL-TK, together with CcTlr19 expression vector or an empty vector (control) were transfected into 293 T cells. After 48 h, Firefly and Renilla luciferase activity was detected, and the ratio was calculated. Means  ±  SD (n  =  4), *P  <  0.05, **P  <  0.01, ***P  <  0.001, ****P  <  0.0001, one-way ANOVA.

Acknowledgments
This image is the copyrighted work of the attributed author or publisher, and ZFIN has permission only to display this image to its users. Additional permissions should be obtained from the applicable author or publisher of the image. Full text @ Vet. Res.