FIGURE SUMMARY
Title

Exposure to ethanol leads to midfacial hypoplasia in a zebrafish model of FASD via indirect interactions with the Shh pathway

Authors
Sidik, A., Dixon, G., Buckley, D.M., Kirby, H.G., Sun, S., Eberhart, J.K.
Source
Full text @ BMC Biol.

Ethanol interacts with vangl2 during early embryogenesis. a Quantification of the distance between the lenses in embryos treated with 1% ethanol for 24 h, initiating at four different stages [3.3, 4, 4.5, and 6 h post fertilization (hpf)]. Statistical significance of differences between groups is indicated with compact letter display. Groups with different letters are significantly different from one another (p < 0.05; Tukey’s honest test). Sample size and p values provided in Additional file 9: Table S2. b Percentage of embryos with complete cyclopia following each treatment. Heterozygous embryos were most sensitive to ethanol when exposed from 3.3 to 27.3 hpf. Mutants were most sensitive from 6 to 30 hpf

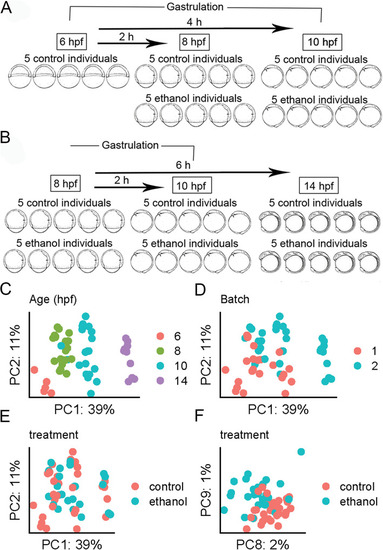
Developmental age is the dominant driver of variation in the dataset. a Schematic representation of the RNA-seq experimental design. Wild-type AB embryos were exposed to 1% ethanol at shield stage (6 hpf). Embryos were subsequently collected at 8 and 10 hpf for experiment 1 and b 8, 10, and 14 hpf, for experiment 2. c–f Principal components analysis (PCA) of the top 25,000 most variable genes. The percentage of variance explained is given on each axis label. c PC1 and PC2 color coded by developmental age. d PC1 and PC2 color coded by RNA-seq experiment (batch). e PC1 and PC2 color coded by ethanol treatment group. f PC8 and PC9 showing separation of ethanol-treated and control samples

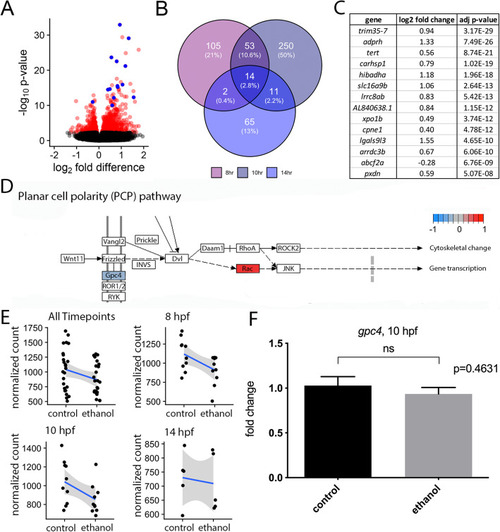
Effects on transcription are largely distinct between developmental time points. a Volcano plot showing differential expression due to ethanol treatment across all samples. Significant genes (FDR < 0.1) are indicated in red. Genes that were significant at all time points are indicated in blue. b Venn-diagram showing overlap of significant genes between the three individual timepoints. Total number of genes is indicated for each time point and overlapping time points. Percentage of significant genes out of the total number of genes is included in parentheses. c Genes that were significant at all timepoints. d KEGG pathway schematic illustrating differential expression due to ethanol treatment in the Wnt/PCP pathway. Color coding indicates log2 fold differences due to ethanol treatment across all samples. Only pathway members with significant changes were color coded. e Normalized read counts indicating expression of gpc4 across different subsets of the dataset. f RT-qPCR of gpc4 in 10 hpf control and ethanol-treated wild-type embryos. n=7, for each group (p = 0.4631)

EXPRESSION / LABELING:
Gene:
Fish:
Anatomical Term:
Stage: Bud

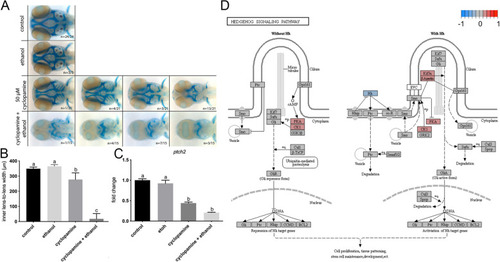
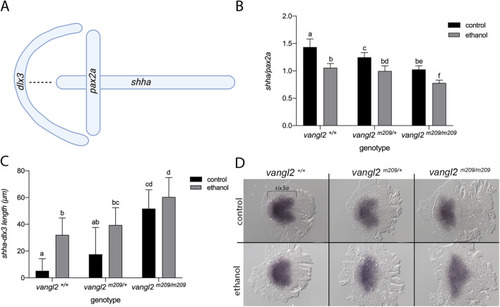
Ethanol indirectly attenuates Shh signaling.
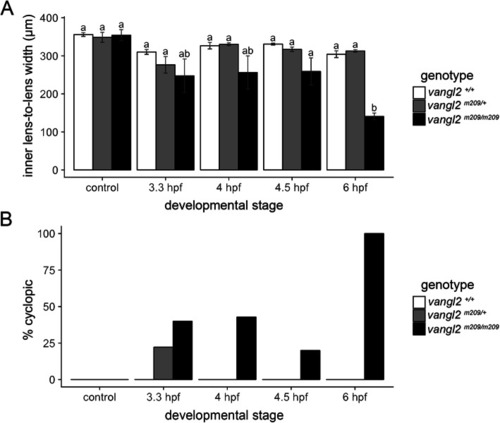
 a Alcian blue and Alizarin red whole mount staining of 4 dpf control, cyclopamine-treated (50 μM), and ethanol- and cyclopamine-treated (1% ethanol plus 50 μM cyclopamine) wild-type embryos from 6 hpf to 4 dpf. Horizontal panels represent the spectrum of phenotypes observed for the treatment groups. Dorsal view, anterior to the left. b Quantification of the effect on inner lens-to-lens width. Both cyclopamine alone and cyclopamine and ethanol were significantly different from controls (p < 0.0001; Tukey’s honest test). Sample size and p values provided in Additional file 9: Table S2. c RT-qPCR of ptch2 in 10 hpf control and ethanol- and/or cyclopamine-treated wild-type embryos. n = 4, for all groups (p < 0.05; Tukey’s honest test). P values provided in Additional file 9: Table S2. d KEGG pathway schematic illustrating differential expression due to ethanol treatment in the sonic hedgehog (Shh) signaling pathway. Color coding indicates log2 fold differences due to ethanol treatment across all samples

Ethanol disrupts convergent extension. a Schematic of the in situ expression domains of shha (midline), pax2a (midbrain-hindbrain boundary), and dlx3 (anterior neural plate) at 10 hpf. The dotted line indicates the shha-dlx3 length measured in panel C. Dorsal view, anterior to the left. Created with BioRender.com. b Quantification for the normalized shha/pax2a expression domains (p < 0.05; Tukey’s honest test). Sample size and p values provided in Additional file 9: Table S2. c Quantification of the distance between shha and dlx3, as shown by the dotted line in panel A (p < 0.05; Tukey’s honest test). Sample size and p values provided in Additional file 9: Table S2. d Expression pattern of six3a via whole mount in situ hybridization, in control and ethanol-treated vangl2 embryos at 11 hpf

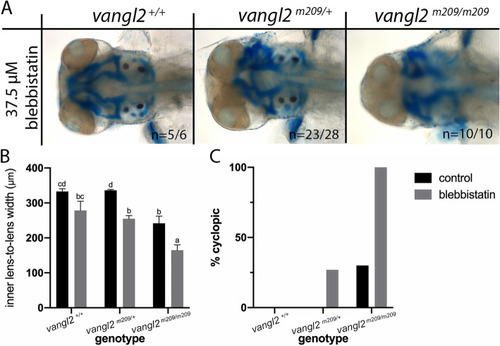
Blebbistatin phenocopies ethanol treatment in vangl2 mutants. a Alcian blue and Alizarin red whole-mount staining of 4 dpf vangl2 embryos treated with blebbistatin (37.5μM, 6–10 hpf). Dorsal view, anterior to the left. b Quantification of the inner lens-to-lens width of control and blebbistatin-treated embryos (p < 0.05; Tukey’s honest test). Sample size and p values provided in Additional file 9: Table S2. c Percentage of embryos exhibiting cyclopia

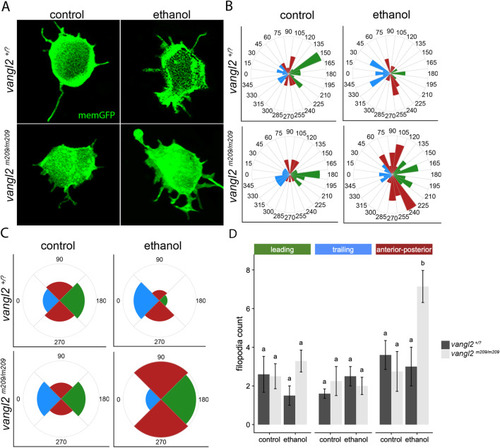
Ethanol disrupts the polarity of membrane protrusions in vangl2 mutants. a Confocal images of mesodermal cells expressing memGFP at 10 hpf. Ethanol treatment from 6–10 hpf. b–c Rose diagram of filopodial projections representing length and distribution around the cells, using b 24 bins, divided into 15° angles or c 4 bins, divided into 90° angles. Horizontal plane (0°) represents the mediolateral axis; vertical plane (90°) represents the anterior-posterior axis. d Quantification of the number of filopodia. n=6, for each group (p < 0.05; Tukey’s honest test). P values provided in Additional file 9: Table S2

Acknowledgments
This image is the copyrighted work of the attributed author or publisher, and ZFIN has permission only to display this image to its users. Additional permissions should be obtained from the applicable author or publisher of the image. Full text @ BMC Biol.