FIGURE

Fig. 3.

ID
ZDB-FIG-210708-42
Publication
Sidik et al., 2021 - Exposure to ethanol leads to midfacial hypoplasia in a zebrafish model of FASD via indirect interactions with the Shh pathway
Other Figures
All Figure Page
Back to All Figure Page
Fig. 3.

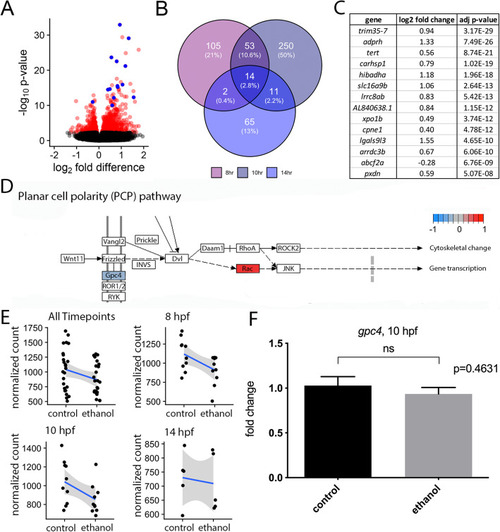
Effects on transcription are largely distinct between developmental time points. a Volcano plot showing differential expression due to ethanol treatment across all samples. Significant genes (FDR < 0.1) are indicated in red. Genes that were significant at all time points are indicated in blue. b Venn-diagram showing overlap of significant genes between the three individual timepoints. Total number of genes is indicated for each time point and overlapping time points. Percentage of significant genes out of the total number of genes is included in parentheses. c Genes that were significant at all timepoints. d KEGG pathway schematic illustrating differential expression due to ethanol treatment in the Wnt/PCP pathway. Color coding indicates log2 fold differences due to ethanol treatment across all samples. Only pathway members with significant changes were color coded. e Normalized read counts indicating expression of gpc4 across different subsets of the dataset. f RT-qPCR of gpc4 in 10 hpf control and ethanol-treated wild-type embryos. n=7, for each group (p = 0.4631)

Expression Data
Gene:
Fish:
Anatomical Term:
Stage: Bud

Expression Detail
Antibody Labeling
Phenotype Data

Phenotype Detail
Acknowledgments
This image is the copyrighted work of the attributed author or publisher, and ZFIN has permission only to display this image to its users. Additional permissions should be obtained from the applicable author or publisher of the image. Full text @ BMC Biol.