
Fig. 2.
- ID
- ZDB-IMAGE-210708-44
- Publication
- Sidik et al., 2021 - Exposure to ethanol leads to midfacial hypoplasia in a zebrafish model of FASD via indirect interactions with the Shh pathway
- All Figures
- Figures for Sidik et al., 2021
|
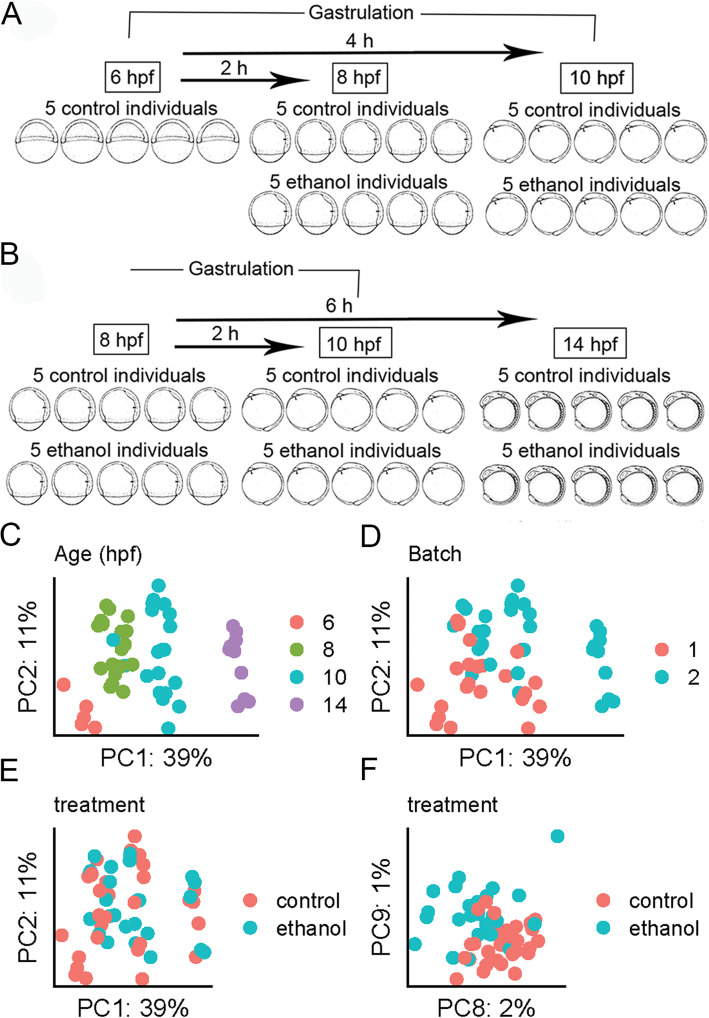
Fig. 2. Developmental age is the dominant driver of variation in the dataset. a Schematic representation of the RNA-seq experimental design. Wild-type AB embryos were exposed to 1% ethanol at shield stage (6 hpf). Embryos were subsequently collected at 8 and 10 hpf for experiment 1 and b 8, 10, and 14 hpf, for experiment 2. c–f Principal components analysis (PCA) of the top 25,000 most variable genes. The percentage of variance explained is given on each axis label. c PC1 and PC2 color coded by developmental age. d PC1 and PC2 color coded by RNA-seq experiment (batch). e PC1 and PC2 color coded by ethanol treatment group. f PC8 and PC9 showing separation of ethanol-treated and control samples