
- Title
-
Maximally selective single-cell target for circuit control in epilepsy models
- Authors
- Hadjiabadi, D., Lovett-Barron, M., Raikov, I.G., Sparks, F.T., Liao, Z., Baraban, S.C., Leskovec, J., Losonczy, A., Deisseroth, K., Soltesz, I.
- Source
- Full text @ Neuron
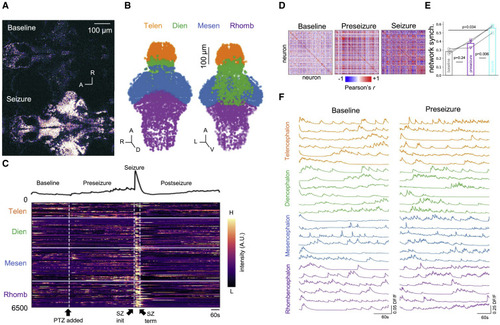
Figure 1. Whole-brain imaging of larval zebrafish acute seizure model at single-cell resolution (A) Representative z-plane images acquired from whole-brain cellular resolution two-photon microscopy of larval zebrafish before PTZ application (Baseline; top) and during PTZ-induced seizure (Seizure; bottom). (B) Extracted neural somata point cloud. Colors indicate major brain regions. Orange, telencephalon; green, diencephalon; blue, mesencephalon; purple: rhombencephalon. (C) (Top) Population mean calcium signal and (bottom) heatmap of single-cell functional calcium dynamics from neurons extracted in (B). PTZ application, seizure initiation, and seizure termination are demarcated by black arrows at bottom. Imaging was performed for 25 min and PTZ was added 5 min into the imaging session. (D) Correlation coefficient matrices of single-cell calcium dynamics during baseline, preseizure, and seizure epochs. (E) Quantification of network synchrony from correlation coefficient matrices in (D) show that single-cell calcium dynamics during seizure epoch are significantly more synchronized compared with single-cell calcium dynamics in baseline (one-sided paired t test, adjusted p = 0.034) and in preseizure (one-sided paired t test, adjusted p = 0.006 epochs. Bar graphs represent the mean of the population (N = 3 zebrafish). (F) Single-cell calcium traces over major anatomical regions plotted during baseline and preseizure epochs. Note the differences in vertical scale bars. |
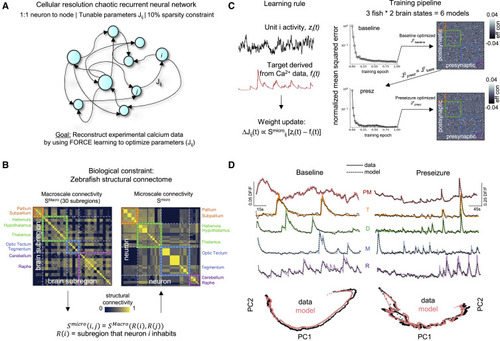
Figure 2. Cellular resolution effective connectivity modeling to extract cell-cell communication networks (A) Cellular resolution chaotic recurrent neural network (RNN) with 10% sparsity constraint to prevent overfitting. Each neuron imaged in the larval zebrafish is represented as a node in the RNN. Edges represent parameters of the model and were optimized with FORCE learning to match experimental calcium data. (B) The zebrafish structural connectome was incorporated as a biological constraint. Left: zebrafish macroscale connectivity matrix (SMacro). Right: zebrafish microscale connectivity (Smicro), which represents the strength of connectivity between the regions in which neurons i and j occupy. (C) Learning rule: FORCE learning tunes the weight Jij between neuron i (target) and j (source). The update is proportional to the structural connectivity score Smicroij, multiplied by the difference between unit activity of node i (black trace) and target Ca2+ waveform acquired experimentally (red trace). Training pipeline: models converged using the weight update that incorporated the structural connectome. The baseline model was trained on baseline calcium dynamics with an initial random matrix. To map the changes to the underlying microcircuit connectivity resulting from bath wash in of PTZ, the optimized parameters of the baseline model were then used as the seed for training the preseizure model on preseizure calcium dynamics. See also Figure S1. (D) Representative examples of mean population Ca2+ trace and individual Ca2+ traces with modeled fits overlaid for baseline (left) and preseizure (right) dynamics. Note the scale bars. Bottom: principal-component analysis (PCA) of experimental (black) and modeled (red) calcium activity. PM, population mean; T, telencephalon; D, diencephalon; M, mesencephalon; R, rhombencephalon. See also Figure S2. |
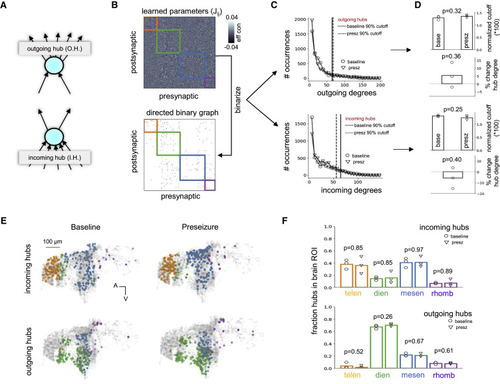
Figure 3. Identification of outgoing and incoming hubs (A) Hub neurons from modeled networks were separated into incoming (numerous and strong postsynaptic inputs) and outgoing (numerous and strong presynaptic outputs). (B and C) Algorithm for identifying incoming and outgoing hub neurons in an effective connectivity matrix optimized though constrained FORCE learning. (B) The learned parameters (top) are binarized into a 0-1 graph (bottom) by keeping the top 10% of excitatory weights. Then, the incoming and outgoing degree for each neuron is calculated from the binarized graph. (C) Baseline and preseizure network degree distributions for outgoing (top) and incoming (bottom) degree are heavy tailed, resembling a power law. A 90% cutoff (vertical lines) was used to identify outgoing and incoming hubs in each network. (D) Ninety percent threshold cutoff normalized by the number of possible connections a single node can make in a graph with N total nodes (i.e., N − 1) and percentage change of average hub degree as measured from outgoing (top) and incoming (bottom) degree distributions. Neither parameter was statistically significant between baseline and preseizure networks (two-sided unpaired t test, p > 0.05). Bar graphs represent the mean of the population (N = 3 zebrafish). (E) Spatial distribution of incoming (top) and outgoing (bottom) hubs for modeled baseline and preseizure networks. Orange, telencephalon; green, diencephalon; blue, mesencephalon; purple, rhombencephalon. (F) Fraction of incoming (top) and outgoing (bottom) hubs residing in each macroscale brain region for baseline (open circle) and preseizure (open triangle) networks. Incoming hubs were consistently localized to telencephalon and mesencephalon. Outgoing hubs were consistently localized to diencephalon. Baseline and preseizure networks had similar macroscale spatial organization of incoming and outgoing hubs (two-sided unpaired t test, p > 0.05). Bar graphs represent the mean of the population (N = 3 zebrafish). |
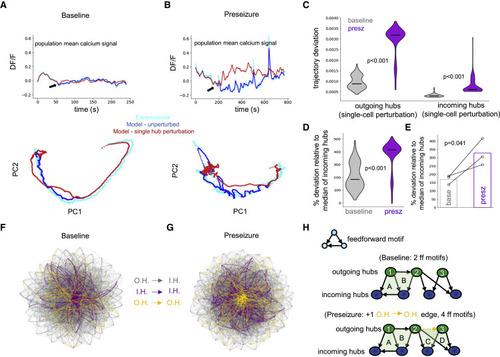
Figure 4. Perturbation of individual outgoing hubs destabilizes preseizure networks (A) Modeled control network response to perturbation (black arrow) of a single outgoing hub. Top: population mean calcium signal of experimental data (cyan), unperturbed model (blue), and perturbed model simulation (red). Bottom: principal-component analysis (PCA) reveals little change in network dynamics in response to perturbation. (B) Perturbation of a single outgoing hub in modeled preseizure network showing significant changes to network dynamics compared with (A). (C) Violin plots show that perturbing individual outgoing hubs (one-sided Mann-Whitney U test, p < 0.001; N = 310 modeled cells) and incoming hubs (one-sided Mann-Whitney U test, p < 0.001; N = 300 modeled cells) in modeled preseizure networks (purple) had significantly higher influence on network dynamics compared with similar simulations in baseline networks (gray). See also Figure S3. Center marker of the violin plot represents the median. (D) Outgoing hub trajectory deviation distributions in modeled baseline (gray) and preseizure networks (purple) normalized by incoming hub median trajectory deviation score for the respective populations. Perturbation of outgoing hubs in preseizure state has significantly more influence over network dynamics (one-sided Mann-Whitney U test, p < 0.001; N = 310 modeled cells). Center marker of the violin plot represents the median. (E) Median values from (D) were extracted for each fish and plotted, revealing that preseizure networks have significantly reduced resiliency to perturbation of a single outgoing hub (one-sided paired t test, p = 0.041). Bar graphs represent the mean of the population (N = 3 zebrafish). (F and G) Visual representation of connections between outgoing and incoming hubs for baseline (F) and preseizure (G) network after constrained FORCE learning. Graphs were generated using the Barnes-Hut algorithm (Barnes and Hut, 1986). Gray edges, outgoing hubs (O.H.) to incoming hubs (I.H.); purple edges, incoming hubs to incoming hubs; golden edges, outgoing hubs to outgoing hubs. See also Figure S3. (H) Toy model of connections between outgoing (green) and incoming (blue) hubs for baseline (top) and preseizure (bottom) networks. |
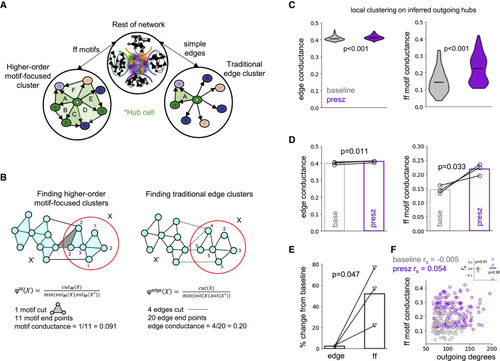
Figure 5. Preferential emergence of superhubs in the preseizure brain (A) Higher order motif-focused clustering enables identification of a collection of nodes that form rich feedforward connections with a single hub neuron (left). This approach contrasts to traditional edge clustering, which considers only simple edges (right). Note that different clusters emerge depending on which method is used. (B) Toy model of higher order motif-focused clustering (left) and edge clustering (right) (from Yin et al., 2017). Edge conductance quantifies the cluster quality by considering the ratio of edges that span between partitions and that reside completely inside the partition. The motif conductance metric measures the same ratio but with respect to motifs. Intuitively, the higher the conductance, the more easily it is for excitatory activity to propagate downstream. (C) Violin plots of edge conductance (left) and feedforward motif conductance (right) of outgoing hub neurons, with the center marker representing the median. Both edge (one-sided Mann-Whitney U test, p < 0.001; N = 310 modeled cells) and feedforward motif conductance (one-sided Mann-Whitney U test, p < 0.001; baseline N = 103 modeled cells, presz N = 151 modeled cells) are higher in modeled preseizure than modeled baseline networks. However, note the differences in range. This predicts the emergence of “superhubs” in preseizure networks. See also Figures S4 and S5 and see STAR Methods for exclusionary criteria when quantifying feedforward motif conductance. (D) Edge conductance (one-sided paired t test, p = 0.011) and feedforward motif conductance (one-sided paired t test, p = 0.033) are significantly increased in modeled preseizure networks across the sample population. Medians from (C) are plotted, and bar graphs represent the mean of the population (N = 3 zebrafish). (E) Percentage change of feedforward motif conductance relative to baseline was significantly greater than edge conductance (one-sided paired t test, p = 0.047). Bar graphs represent the mean of the population (N = 3 zebrafish). (F) Scatterplot of feedforward motif conductance versus outgoing degree of hubs in baseline (N = 103 modeled cells) and preseizure (N = 151 modeled cells) networks reported no significant correlation (baseline Spearman's rho = −0.005, p > 0.05; preseizure Spearman's rho = 0.054, p > 0.05) between the two variables individually or as a group (see inset; bar graph represents the mean of the population, N = 3 zebrafish). See also Figure S6. |
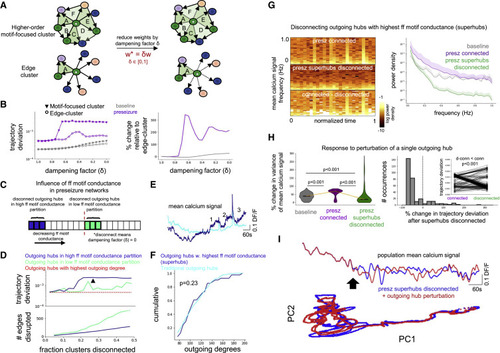
Figure 6. Disconnecting superhubs stabilizes preseizure networks (A) Edge weights of all outgoing hubs targeting its edge cluster constituents and higher order motif-focused cluster constituents were dampened to explore relative importance of simple edges versus edges belonging to feedforward motifs on network dynamics. (B) Left: connections from outgoing hubs projecting to their traditional edge-cluster (open circle) and to their higher order motif-focused cluster (closed triangle) were progressively dampened for modeled baseline (gray) and preseizure (purple) networks. Dampening higher order motif-focused clusters had greater effect on network dynamics than dampening traditional edge clusters, as measured by trajectory deviation. Right: trajectory deviation from dampening higher order motif-focused clusters relative to dampening traditional edge clusters shows a greater effect in the preseizure network than the baseline network. (C) Schematic for testing the effect of disconnecting outgoing hubs with the highest feedforward motif conductance versus lowest feedforward motif conductance on modeled preseizure network dynamics. (D) Top: trajectory deviation versus fraction of higher order motif-focused clusters disconnected in the high feedforward motif conductance (blue) and low feedforward motif conductance (green) partitions show that disconnecting higher conductance clusters has greater effect on network dynamics. The black arrowhead is located at the 27.5% cutoff for superhubs (N = 41 modeled cells), which is where blue trace exhibits a stable plateau in the trajectory deviation. Bottom: number of edges disconnected for each group shows that the high conductance partition (blue) contains fewer edges than the low conductance partition (green). (E) Mean calcium signal of outgoing hubs with the highest feedforward motif conductance values (i.e., superhubs) and the traditional outgoing hub population. Note the numbers identifying an increase in the mean calcium signal of superhubs preceding and between high-calcium events. (F) Outgoing degree cumulative distribution for superhubs (N = 41 modeled cells) versus traditional outgoing hubs (N = 269 modeled cells). Importantly, superhubs are not biased toward the highest outgoing degrees (one-sided KS-test, p = 0.23). (G) Left: mean population calcium signal spectrograms generated from unchanged/connected preseizure network (top), preseizure network with superhubs disconnected (middle), and difference. Right: power spectral density (PSD) of mean population calcium signal for baseline (gray), connected preseizure (violet), and preseizure network with superhubs disconnected (green). Disconnecting superhubs reduces power over the measured frequency ranges. (H) Left: the variance (i.e., total power) of the mean population calcium signal is measured before and after perturbation of a single outgoing hub, and the percentage change is quantified. The percentage change in total power is elevated when perturbing individual outgoing hubs in the fully connected preseizure network (purple) compared with baseline network (gray) (one-sided Mann-Whitney U test, adjusted p < 0.001), indicating that the preseizure network is more unstable. The percentage change in total power is significantly lower in the preseizure network with superhubs disconnected (green) compared with the fully connected preseizure network (purple) (one-sided Wilcoxon signed-rank test, adjusted p < 0.001). Furthermore, the percentage change in total power after perturbing individual hubs is significantly lower between the preseizure network with superhubs disconnected (green) and the baseline network (gray) (one-sided Mann-Whitney U test, adjusted p < 0.001), altogether providing evidence that disconnecting superhubs very robustly stabilizes preseizure networks. N = 310 modeled cells for all groups. Center marker of violin plots represents the median. Right: percentage change of the network trajectory deviation is significantly reduced after disconnecting superhubs (one-sided Wilcoxon signed-rank test, p < 0.001; N = 310 modeled cells). This was quantified by measuring trajectory deviation before and after perturbation of a single outgoing hub in the fully connected preseizure network and the preseizure network with superhubs disconnected. See also Figure S6. (I) Top: mean population calcium signal of a disconnected preseizure network before (blue) and after (red) perturbation of a single outgoing hub. Bottom: principal-component analysis (PCA) before (blue) and after (red) perturbation. |
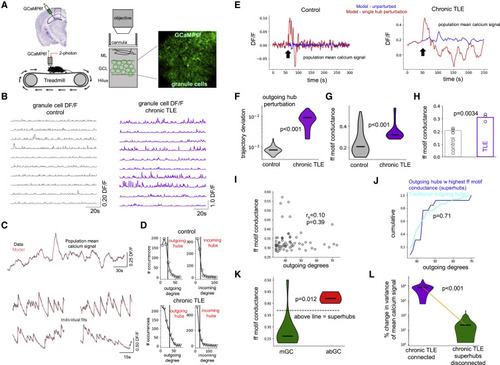
Figure 7. Superhubs in the intrahippocampal kainic acid mouse model of chronical temporal lobe epilepsy (A) Experimental setup. Control and chronically epileptic mice were virally injected with GCaMP in dentate gyrus (DG) and imaged with two-photon (2p) microscope. (B) DG granule cell DF/F for control and chronically epileptic mouse. (C) Model fits of experimentally recorded granule cells from chronically epileptic granule mouse using FORCE learning. (D) Outgoing and incoming degree distributions for modeled control dentate and chronically epileptic dentate networks showing heavy-tailed distributions. (E) Network response to perturbation (black arrows) of a single outgoing hub neuron in a modeled control (left) and modeled chronically epileptic (right) network. (F) Trajectory deviation in response to perturbation of individual outgoing hubs is significantly higher (one-sided Mann-Whitney U test, p < 0.001) in modeled chronically epileptic dentate network (purple, N = 28 modeled cells) than in modeled control network (gray; N = 59 modeled cells). Center marker of the violin plot represents the median. (G) Feedforward motif conductance of individual outgoing hubs is significantly higher (one-sided Mann-Whitney U test, p < 0.001) in modeled chronically epileptic dentate network (purple, N = 27 modeled cells) than in modeled control network (gray; N = 49 modeled cells). Center marker of the violin plot represents the median. (H) Feedforward motif conductance is significantly increased in modeled chronically epileptic networks across the sample population (one-sided unpaired t test, p = 0.0034). Bar graphs represents the mean of the population (N = 3 mice). (I) Outgoing degrees and feedforward motif conductance are not significantly correlated (Spearman's rho = 0.10, p = 0.39; N = 49 modeled neurons). (J) Outgoing degree cumulative distribution for superhubs (N = 8 modeled cells) versus traditional outgoing hubs (N = 19 modeled cells). Superhubs did not have the highest outgoing degrees (one-sided KS-test, p = 0.71). (K) Feedforward motif conductance of adult-born granule cells (red; N = 6 modeled cells) is significantly greater than mature granule cells (green; N = 21 modeled cells) (one-sided Mann-Whitney U test, p = 0.012). Dashed line represents cutoff for superhub status. Center marker of the violin plot represents the median. (L) Disconnecting all superhubs simultaneously significantly reduced the response of a modeled chronically epileptic dentate network to single outgoing hub perturbation, as measured by the percentage change in global signal variance (one-sided Wilcoxon signed-rank test, p < 0.001; N = 27 modeled cells). Center marker of the violin plot represents the median. See also Figure S7. |