
Fig. 5
- ID
- ZDB-FIG-221004-42
- Publication
- Hadjiabadi et al., 2021 - Maximally selective single-cell target for circuit control in epilepsy models
- Other Figures
- All Figure Page
- Back to All Figure Page
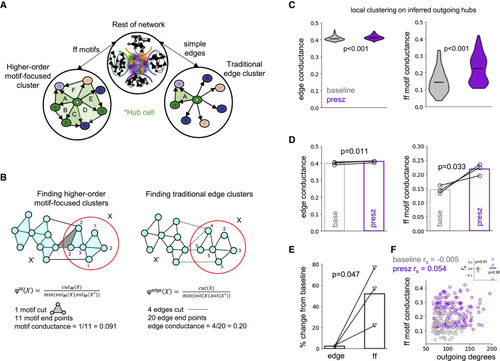
Figure 5. Preferential emergence of superhubs in the preseizure brain (A) Higher order motif-focused clustering enables identification of a collection of nodes that form rich feedforward connections with a single hub neuron (left). This approach contrasts to traditional edge clustering, which considers only simple edges (right). Note that different clusters emerge depending on which method is used. (B) Toy model of higher order motif-focused clustering (left) and edge clustering (right) (from Yin et al., 2017). Edge conductance quantifies the cluster quality by considering the ratio of edges that span between partitions and that reside completely inside the partition. The motif conductance metric measures the same ratio but with respect to motifs. Intuitively, the higher the conductance, the more easily it is for excitatory activity to propagate downstream. (C) Violin plots of edge conductance (left) and feedforward motif conductance (right) of outgoing hub neurons, with the center marker representing the median. Both edge (one-sided Mann-Whitney U test, p < 0.001; N = 310 modeled cells) and feedforward motif conductance (one-sided Mann-Whitney U test, p < 0.001; baseline N = 103 modeled cells, presz N = 151 modeled cells) are higher in modeled preseizure than modeled baseline networks. However, note the differences in range. This predicts the emergence of “superhubs” in preseizure networks. See also Figures S4 and S5 and see STAR Methods for exclusionary criteria when quantifying feedforward motif conductance. (D) Edge conductance (one-sided paired t test, p = 0.011) and feedforward motif conductance (one-sided paired t test, p = 0.033) are significantly increased in modeled preseizure networks across the sample population. Medians from (C) are plotted, and bar graphs represent the mean of the population (N = 3 zebrafish). (E) Percentage change of feedforward motif conductance relative to baseline was significantly greater than edge conductance (one-sided paired t test, p = 0.047). Bar graphs represent the mean of the population (N = 3 zebrafish). (F) Scatterplot of feedforward motif conductance versus outgoing degree of hubs in baseline (N = 103 modeled cells) and preseizure (N = 151 modeled cells) networks reported no significant correlation (baseline Spearman's rho = −0.005, p > 0.05; preseizure Spearman's rho = 0.054, p > 0.05) between the two variables individually or as a group (see inset; bar graph represents the mean of the population, N = 3 zebrafish). See also Figure S6. |