
Fig. 6
- ID
- ZDB-FIG-221004-43
- Publication
- Hadjiabadi et al., 2021 - Maximally selective single-cell target for circuit control in epilepsy models
- Other Figures
- All Figure Page
- Back to All Figure Page
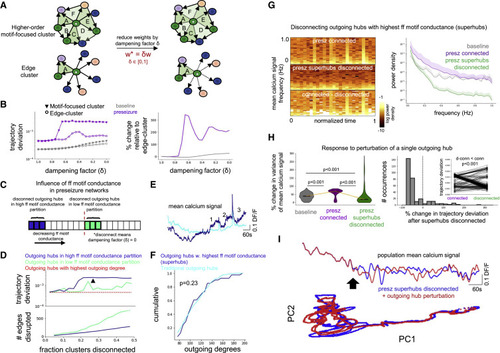
Figure 6. Disconnecting superhubs stabilizes preseizure networks (A) Edge weights of all outgoing hubs targeting its edge cluster constituents and higher order motif-focused cluster constituents were dampened to explore relative importance of simple edges versus edges belonging to feedforward motifs on network dynamics. (B) Left: connections from outgoing hubs projecting to their traditional edge-cluster (open circle) and to their higher order motif-focused cluster (closed triangle) were progressively dampened for modeled baseline (gray) and preseizure (purple) networks. Dampening higher order motif-focused clusters had greater effect on network dynamics than dampening traditional edge clusters, as measured by trajectory deviation. Right: trajectory deviation from dampening higher order motif-focused clusters relative to dampening traditional edge clusters shows a greater effect in the preseizure network than the baseline network. (C) Schematic for testing the effect of disconnecting outgoing hubs with the highest feedforward motif conductance versus lowest feedforward motif conductance on modeled preseizure network dynamics. (D) Top: trajectory deviation versus fraction of higher order motif-focused clusters disconnected in the high feedforward motif conductance (blue) and low feedforward motif conductance (green) partitions show that disconnecting higher conductance clusters has greater effect on network dynamics. The black arrowhead is located at the 27.5% cutoff for superhubs (N = 41 modeled cells), which is where blue trace exhibits a stable plateau in the trajectory deviation. Bottom: number of edges disconnected for each group shows that the high conductance partition (blue) contains fewer edges than the low conductance partition (green). (E) Mean calcium signal of outgoing hubs with the highest feedforward motif conductance values (i.e., superhubs) and the traditional outgoing hub population. Note the numbers identifying an increase in the mean calcium signal of superhubs preceding and between high-calcium events. (F) Outgoing degree cumulative distribution for superhubs (N = 41 modeled cells) versus traditional outgoing hubs (N = 269 modeled cells). Importantly, superhubs are not biased toward the highest outgoing degrees (one-sided KS-test, p = 0.23). (G) Left: mean population calcium signal spectrograms generated from unchanged/connected preseizure network (top), preseizure network with superhubs disconnected (middle), and difference. Right: power spectral density (PSD) of mean population calcium signal for baseline (gray), connected preseizure (violet), and preseizure network with superhubs disconnected (green). Disconnecting superhubs reduces power over the measured frequency ranges. (H) Left: the variance (i.e., total power) of the mean population calcium signal is measured before and after perturbation of a single outgoing hub, and the percentage change is quantified. The percentage change in total power is elevated when perturbing individual outgoing hubs in the fully connected preseizure network (purple) compared with baseline network (gray) (one-sided Mann-Whitney U test, adjusted p < 0.001), indicating that the preseizure network is more unstable. The percentage change in total power is significantly lower in the preseizure network with superhubs disconnected (green) compared with the fully connected preseizure network (purple) (one-sided Wilcoxon signed-rank test, adjusted p < 0.001). Furthermore, the percentage change in total power after perturbing individual hubs is significantly lower between the preseizure network with superhubs disconnected (green) and the baseline network (gray) (one-sided Mann-Whitney U test, adjusted p < 0.001), altogether providing evidence that disconnecting superhubs very robustly stabilizes preseizure networks. N = 310 modeled cells for all groups. Center marker of violin plots represents the median. Right: percentage change of the network trajectory deviation is significantly reduced after disconnecting superhubs (one-sided Wilcoxon signed-rank test, p < 0.001; N = 310 modeled cells). This was quantified by measuring trajectory deviation before and after perturbation of a single outgoing hub in the fully connected preseizure network and the preseizure network with superhubs disconnected. See also Figure S6. (I) Top: mean population calcium signal of a disconnected preseizure network before (blue) and after (red) perturbation of a single outgoing hub. Bottom: principal-component analysis (PCA) before (blue) and after (red) perturbation. |