
Fig. 4
- ID
- ZDB-FIG-221004-41
- Publication
- Hadjiabadi et al., 2021 - Maximally selective single-cell target for circuit control in epilepsy models
- Other Figures
- All Figure Page
- Back to All Figure Page
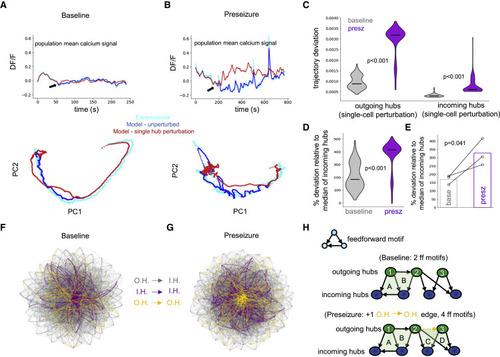
Figure 4. Perturbation of individual outgoing hubs destabilizes preseizure networks (A) Modeled control network response to perturbation (black arrow) of a single outgoing hub. Top: population mean calcium signal of experimental data (cyan), unperturbed model (blue), and perturbed model simulation (red). Bottom: principal-component analysis (PCA) reveals little change in network dynamics in response to perturbation. (B) Perturbation of a single outgoing hub in modeled preseizure network showing significant changes to network dynamics compared with (A). (C) Violin plots show that perturbing individual outgoing hubs (one-sided Mann-Whitney U test, p < 0.001; N = 310 modeled cells) and incoming hubs (one-sided Mann-Whitney U test, p < 0.001; N = 300 modeled cells) in modeled preseizure networks (purple) had significantly higher influence on network dynamics compared with similar simulations in baseline networks (gray). See also Figure S3. Center marker of the violin plot represents the median. (D) Outgoing hub trajectory deviation distributions in modeled baseline (gray) and preseizure networks (purple) normalized by incoming hub median trajectory deviation score for the respective populations. Perturbation of outgoing hubs in preseizure state has significantly more influence over network dynamics (one-sided Mann-Whitney U test, p < 0.001; N = 310 modeled cells). Center marker of the violin plot represents the median. (E) Median values from (D) were extracted for each fish and plotted, revealing that preseizure networks have significantly reduced resiliency to perturbation of a single outgoing hub (one-sided paired t test, p = 0.041). Bar graphs represent the mean of the population (N = 3 zebrafish). (F and G) Visual representation of connections between outgoing and incoming hubs for baseline (F) and preseizure (G) network after constrained FORCE learning. Graphs were generated using the Barnes-Hut algorithm (Barnes and Hut, 1986). Gray edges, outgoing hubs (O.H.) to incoming hubs (I.H.); purple edges, incoming hubs to incoming hubs; golden edges, outgoing hubs to outgoing hubs. See also Figure S3. (H) Toy model of connections between outgoing (green) and incoming (blue) hubs for baseline (top) and preseizure (bottom) networks. |