
Fig. 1
- ID
- ZDB-FIG-221004-38
- Publication
- Hadjiabadi et al., 2021 - Maximally selective single-cell target for circuit control in epilepsy models
- Other Figures
- All Figure Page
- Back to All Figure Page
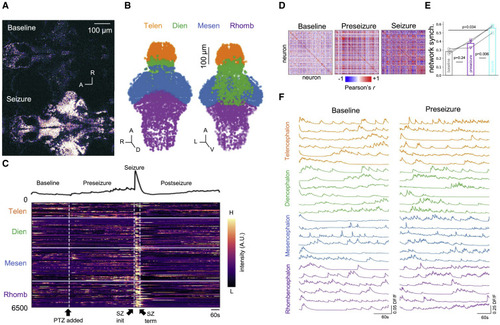
Figure 1. Whole-brain imaging of larval zebrafish acute seizure model at single-cell resolution (A) Representative z-plane images acquired from whole-brain cellular resolution two-photon microscopy of larval zebrafish before PTZ application (Baseline; top) and during PTZ-induced seizure (Seizure; bottom). (B) Extracted neural somata point cloud. Colors indicate major brain regions. Orange, telencephalon; green, diencephalon; blue, mesencephalon; purple: rhombencephalon. (C) (Top) Population mean calcium signal and (bottom) heatmap of single-cell functional calcium dynamics from neurons extracted in (B). PTZ application, seizure initiation, and seizure termination are demarcated by black arrows at bottom. Imaging was performed for 25 min and PTZ was added 5 min into the imaging session. (D) Correlation coefficient matrices of single-cell calcium dynamics during baseline, preseizure, and seizure epochs. (E) Quantification of network synchrony from correlation coefficient matrices in (D) show that single-cell calcium dynamics during seizure epoch are significantly more synchronized compared with single-cell calcium dynamics in baseline (one-sided paired t test, adjusted p = 0.034) and in preseizure (one-sided paired t test, adjusted p = 0.006 epochs. Bar graphs represent the mean of the population (N = 3 zebrafish). (F) Single-cell calcium traces over major anatomical regions plotted during baseline and preseizure epochs. Note the differences in vertical scale bars. |