
|
Fig. 3
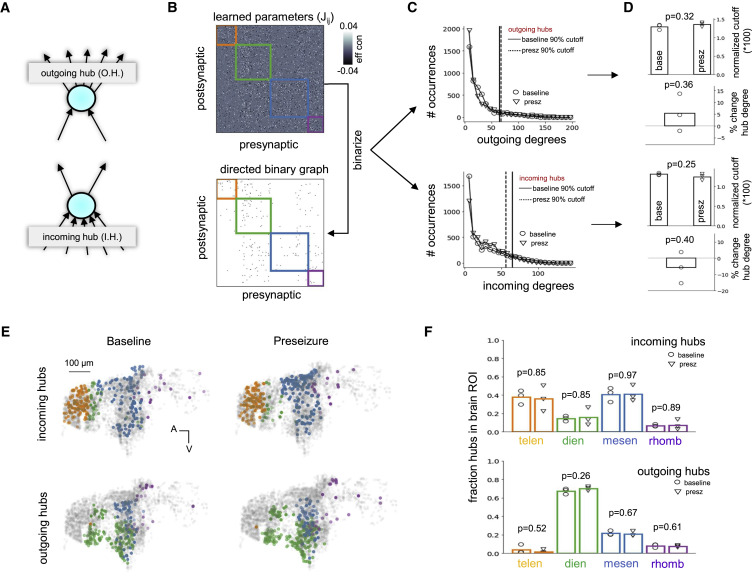
Figure 3. Identification of outgoing and incoming hubs (A) Hub neurons from modeled networks were separated into incoming (numerous and strong postsynaptic inputs) and outgoing (numerous and strong presynaptic outputs). (B and C) Algorithm for identifying incoming and outgoing hub neurons in an effective connectivity matrix optimized though constrained FORCE learning. (B) The learned parameters (top) are binarized into a 0-1 graph (bottom) by keeping the top 10% of excitatory weights. Then, the incoming and outgoing degree for each neuron is calculated from the binarized graph. (C) Baseline and preseizure network degree distributions for outgoing (top) and incoming (bottom) degree are heavy tailed, resembling a power law. A 90% cutoff (vertical lines) was used to identify outgoing and incoming hubs in each network. (D) Ninety percent threshold cutoff normalized by the number of possible connections a single node can make in a graph with N total nodes (i.e., N − 1) and percentage change of average hub degree as measured from outgoing (top) and incoming (bottom) degree distributions. Neither parameter was statistically significant between baseline and preseizure networks (two-sided unpaired t test, p > 0.05). Bar graphs represent the mean of the population (N = 3 zebrafish). (E) Spatial distribution of incoming (top) and outgoing (bottom) hubs for modeled baseline and preseizure networks. Orange, telencephalon; green, diencephalon; blue, mesencephalon; purple, rhombencephalon. (F) Fraction of incoming (top) and outgoing (bottom) hubs residing in each macroscale brain region for baseline (open circle) and preseizure (open triangle) networks. Incoming hubs were consistently localized to telencephalon and mesencephalon. Outgoing hubs were consistently localized to diencephalon. Baseline and preseizure networks had similar macroscale spatial organization of incoming and outgoing hubs (two-sided unpaired t test, p > 0.05). Bar graphs represent the mean of the population (N = 3 zebrafish).