
- Title
-
An in vivo reporter for tracking lipid droplet dynamics in transparent zebrafish
- Authors
- Lumaquin, D., Johns, E., Montal, E., Weiss, J.M., Ola, D., Abuhashem, A., White, R.M.
- Source
- Full text @ Elife
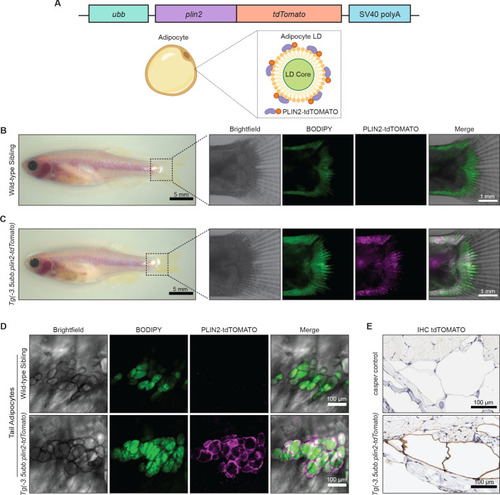
( |

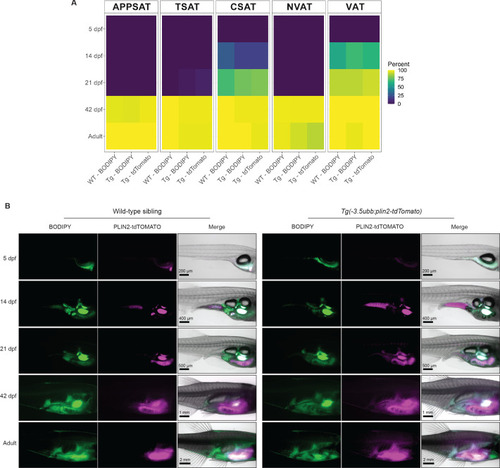
(A) Schematic of visceral adipose tissue development in the 21 days post-fertilization (dpf) zebrafish. Abdominal visceral adipocytes (orange) develop around the swim bladder (gray) and pancreatic visceral adipocytes (red) develop ventrally around the pancreas. (B) Brightfield image of Tg(-3.5ubb:plin2-tdTomato) at 21 dpf. Red box indicates position of higher magnification images to visualize abdominal visceral adipocytes. (C) Widefield microscope images of 21 dpf wild-type casper and Tg(-3.5ubb:plin2-tdTomato) visceral adipocytes around the posterior swim bladder (SB) costained with BODIPY. Panels show brightfield, BODIPY, tdTOMATO, and merge. BODIPY stained adipose tissue was imaged and analyzed for (D) area, (E) standard length, and (F) area/standard length. Points indicate individual fish for N = 3 independent experiments; wild-type sibling, Data values for (D-F). n=35; Tg(-3.5ubb:plin2-tdTomato), n = 28. Bars indicate mean and SEM. Significance calculated via Mann-Whitney test. (G) 21 dpf wild-typecasperandTg(-3.5ubb:plin2-tdTomato)zebrafish were fixed and immunohistochemistry conducted for tdTOMATO expression of abdominal (AVA) and pancreatic visceral adipocytes (PVA). |
(
|
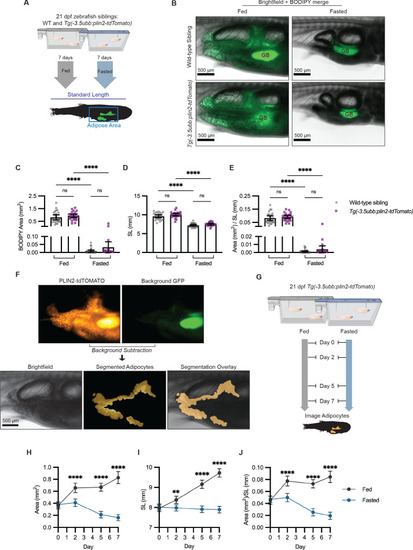
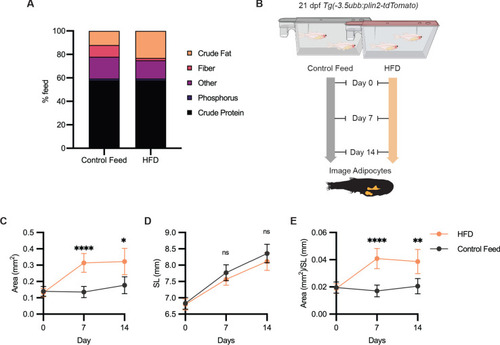
(A) Schematic of experimental set-up for fasting experiment. 21 days post-fertilization (dpf) wild-type casper and Tg(-3.5ubb:plin2-tdTomato) zebrafish were fed or fasted for 7 days and imaged to measure standard length and adipose area. (B) Representative images of zebrafish fed or fasted after 7 days. Panels show merged images of brightfield and BODIPY-stained visceral adipose tissue. BODIPY-stained adipocytes were imaged to measure (C) area, (D) standard length, and (E) area/standard length. Data points indicate individual fish for N = 3 independent experiments; bars indicate mean and 95% CI. Fed wild-type n = 24; fed Tg(-3.5ubb:plin2-tdTomato) n = 24; fasted wild-type n = 29; fasted Tg(-3.5ubb:plin2-tdTomato) n = 20. Significance calculated via Kruskal-Wallis with Dunn’s multiple comparisons test; ****p<0.0001. (F) Representative image of computational segmentation of Tg(-3.5ubb:plin2-tdTomato) adipocytes. PLIN2-tdTOMATO was background subtracted with GFP fluorescence. Bottom panels show brightfield, segmented adipocytes, and segmentation overlaid on brightfield. (G) Schematic of experimental set-up for repeated imaging of 21 dpf Tg(-3.5ubb:plin2-tdTomato) zebrafish, which were fed or fasted for 7 days. Adipose tissue was imaged and analyzed for (H) area, (I) standard length, and (J) area/standard length. Points indicate mean and error bars indicate 95% CI for N = 3 independent experiments; by day 7, fed n = 46 and fasted n = 57. Significance calculated via Mann-Whitney test; **p<0.01, ****p<0.0001. |
(
|
(
|
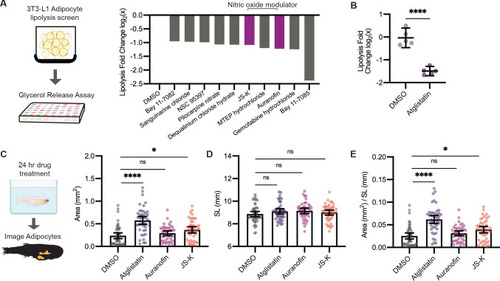
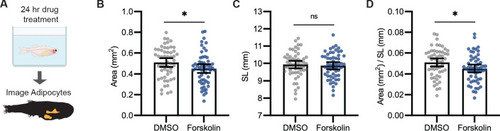
(A) Schematic of pharmacologic lipolysis screen in 3T3-L1 adipocytes using a glycerol release assay. Normalized log2 transformed values for top 10 drugs that inhibit lipolysis are shown. Magenta indicates compounds that modulate nitric oxide. (B) Normalized log2 transformed values for lipolysis inhibition in 3T3-L1 adipocytes using either dimethyl sulfoxide (DMSO) or 100 µM Atglistatin. N = 5 independent experiments. Bars indicate mean and SEM. Significance calculated via Welch’s t-test; ****p<0.0001. (C) Schematic of experimental set-up for drug treatment. 21 days post-fertilization (dpf) Tg(-3.5ubb:plin2-tdTomato) zebrafish were individually placed in six-well plates with either DMSO, 40 µM Atglistatin, 1 µM Auranofin, or 1 µM JS-K for 24 hr. Adipose tissue was imaged and analyzed for (C) area, (D) standard length, and (E) area/standard length. Data points indicate individual fish for N = 4 independent experiments; DMSO n = 47; Atglistatin n = 44; Auranofin n = 42; JS-K n = 44. Bars indicate mean and SEM. Significance calculated via Kruskal-Wallis with Dunn’s multiple comparisons test; *p<0.05, ****p<0.0001. |

Viability of 21 days post-fertilization (dpf)
|

( |
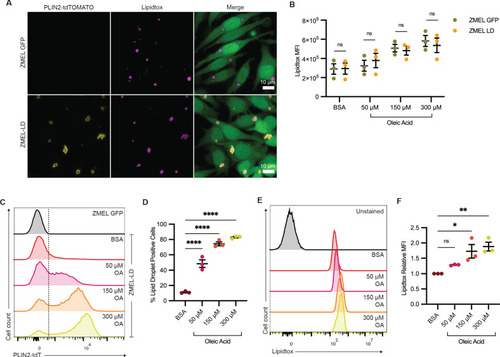
(A) Confocal images of ZMEL-GFP and ZMEL-LD after 24 hr of 150 µM oleic acid treatment. Cells were fixed and stained, with panels showing fluorescence signals for PLIN2-tdTOMATO, Lipidtox (lipid droplet dye), and merge of images with cytoplasmic GFP. ZMEL-GFP and ZMEL-LD cells were treated with bovine serum albumin (BSA) or increasing concentrations of oleic acid for 24 hr and then analyzed by FACS. (B) Comparison of Lipidtox median fluorescence intensity (MFI) between ZMEL-GFP and ZMEL-LD. Significance calculated via Welch’s t-test with Bonferroni correction. (C) Representative histogram of PLIN2-tdTOMATO expression of ZMEL-GFP and ZMEL-LD cells. Dashed line shows the threshold for PLIN2-tdTOMATO expression. (D) Quantification of percent of GFP+ ZMEL-LD cells with lipid droplets. Significance calculated via one-way ANOVA with Dunnett’s multiple comparison test. (E) Representative histogram of Lipidtox expression of ZMEL-LD cells. (F) Quantification of Lipidtox MFI relative to BSA control of GFP+ZMEL-LD cells. Significance calculated via one-way ANOVA with Dunnett’s multiple comparison test. N = 3 independent experiments. Bars indicate mean and SEM. *p<0.05, **p<0.01, ****p<0.0001. |