
Figure 5
- ID
- ZDB-FIG-210617-50
- Publication
- Lumaquin et al., 2021 - An in vivo reporter for tracking lipid droplet dynamics in transparent zebrafish
- Other Figures
- All Figure Page
- Back to All Figure Page
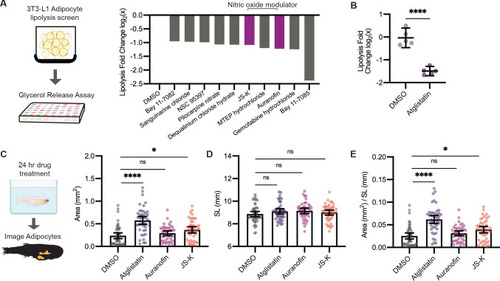
(A) Schematic of pharmacologic lipolysis screen in 3T3-L1 adipocytes using a glycerol release assay. Normalized log2 transformed values for top 10 drugs that inhibit lipolysis are shown. Magenta indicates compounds that modulate nitric oxide. (B) Normalized log2 transformed values for lipolysis inhibition in 3T3-L1 adipocytes using either dimethyl sulfoxide (DMSO) or 100 µM Atglistatin. N = 5 independent experiments. Bars indicate mean and SEM. Significance calculated via Welch’s t-test; ****p<0.0001. (C) Schematic of experimental set-up for drug treatment. 21 days post-fertilization (dpf) Tg(-3.5ubb:plin2-tdTomato) zebrafish were individually placed in six-well plates with either DMSO, 40 µM Atglistatin, 1 µM Auranofin, or 1 µM JS-K for 24 hr. Adipose tissue was imaged and analyzed for (C) area, (D) standard length, and (E) area/standard length. Data points indicate individual fish for N = 4 independent experiments; DMSO n = 47; Atglistatin n = 44; Auranofin n = 42; JS-K n = 44. Bars indicate mean and SEM. Significance calculated via Kruskal-Wallis with Dunn’s multiple comparisons test; *p<0.05, ****p<0.0001. |