FIGURE

Figure 2—figure supplement 1—source data 1.

ID
ZDB-FIG-210617-44
Publication
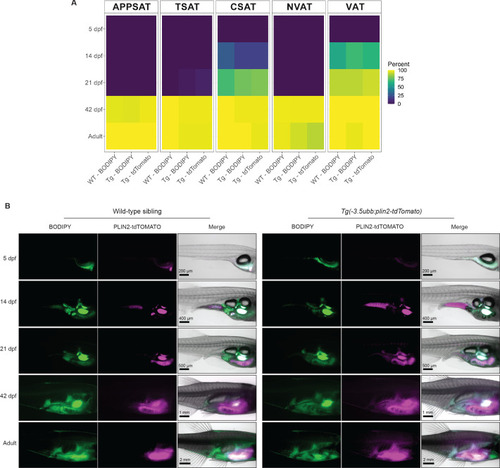
Lumaquin et al., 2021 - An in vivo reporter for tracking lipid droplet dynamics in transparent zebrafish
Other Figures
All Figure Page
Back to All Figure Page
Figure 2—figure supplement 1—source data 1.

Adipose tissue development in wild-type and <italic toggle='yes'>Tg(-3.5ubb-plin2-tdTomato)</italic> zebrafish.

(A) Heatmap of adipose depot presence during zebrafish development in Tg(-3.5ubb:plin2-tdTomato) and wild-type siblings. Shown is the percent of fish scored for presence of the depot using either BODIPY GFP signal or tdTOMATO expression at each time point. (B) Representative whole-mount images demonstrating the timing of adipose tissue development in Tg(-3.5ubb:plin2-tdTomato) and wild-type siblings using visceral adipose tissue as an example. Data points are an average of N = 3 independent experiments for each time point, excluding 14 days post-fertilization (dpf), where N = 4, and the adults, where N = 5 (5 dpf WT n = 32, 5 dpf Tg(-3.5ubb:plin2-tdTomato) n = 38, 14 dpf WT n = 32, 14 dpf Tg(-3.5ubb:plin2-tdTomato) n = 48, 21 dpf WT n = 30, 21 dpf Tg(-3.5ubb:plin2-tdTomato) n = 40, 42 dpf WT n = 48, 42 dpf Tg(-3.5ubb:plin2-tdTomato) n = 43, adult WT n = 38, adult Tg(-3.5ubb:plin2-tdTomato) n = 29).

Expression Data

Expression Detail
Antibody Labeling
Phenotype Data

Phenotype Detail
Acknowledgments
This image is the copyrighted work of the attributed author or publisher, and ZFIN has permission only to display this image to its users. Additional permissions should be obtained from the applicable author or publisher of the image. Full text @ Elife